I was on a panel discussion with Brendon Ogmundson (Chief Economist, BCREA) at the PacificWest conference recently (thanks to all who attended!), and one of the audience questions posed to us at the end of the session has been stuck in my mind ever since.
The audience member asked a seemingly simple question:
“when is the market going to get back to normal?”
It’s a question you might think would have a straightforward answer.
And while I can’t recall my answer at the time, the more I thought about it afterwards, the more I developed my own questions about the question itself.
How meta.
Undefined
One of the funny things about the question is that the answer hinges entirely on what we define as being a “normal market” in the first place.
And while economists rarely agree on anything, I think even most real estate practitioners would all have very different opinions of what they consider a “normal market”.
Time plays an interesting role here as well, because the definition of “normal” also depends on how far back we’re willing (or able) to look in the data.
So, in this post, I’m going to strip this question down to first principles and see if we can come up with an objective definition of “normal”.
And I’m also going to try and (better) answer the question of when the market is going to get back to, well, “normal”.
First principles
At the most fundamental level, a market for housing is made up of buyers and sellers.
And we might say that a housing market is in equilibrium when we observe the following conditions:
Buyers and sellers are transacting, and supply or demand are not at extremes.
Prices are stable, or growing roughly in line with inflation.
There are no major distortions impacting the market as a result of things like recessions, policy changes, or abnormal credit conditions.
In reality, there are many more conditions that we could consider, but these three are a sufficient subset for the purposes of this post.
Whittling down the data
With these conditions in mind, we can analyze the available historical data to try and identify periods of time when the market was “normal”, and when it wasn’t.
Demand
Let’s start out by identifying periods of time where the sales volumes were abnormally high or low, to give us a sense of when demand was at extremes in the past.
There’s a lot of ways we could potentially do this, but for simplicity, let’s state that any time sales were repectively below or above the 10th or 90th percentiles relative to the rolling 10-year average for the same month, we’ll consider it an “extreme” sales period.
I know that’s a fairly technical definition, so for those who prefer simpler words: we’re taking a ten year window of time, moving it forward one month at a time, and looking for periods where sales strayed very far from levels they’ve been at within that rolling ten year window of time.
By using 10th and 90th percentiles, instead of say, 25th and 75th percentiles, we avoid flagging too many periods where sales were just fairly strong, or fairly weak.
These cut points allow us to really hone in on periods where things were really extreme.
Here’s a plot of what that looks like:
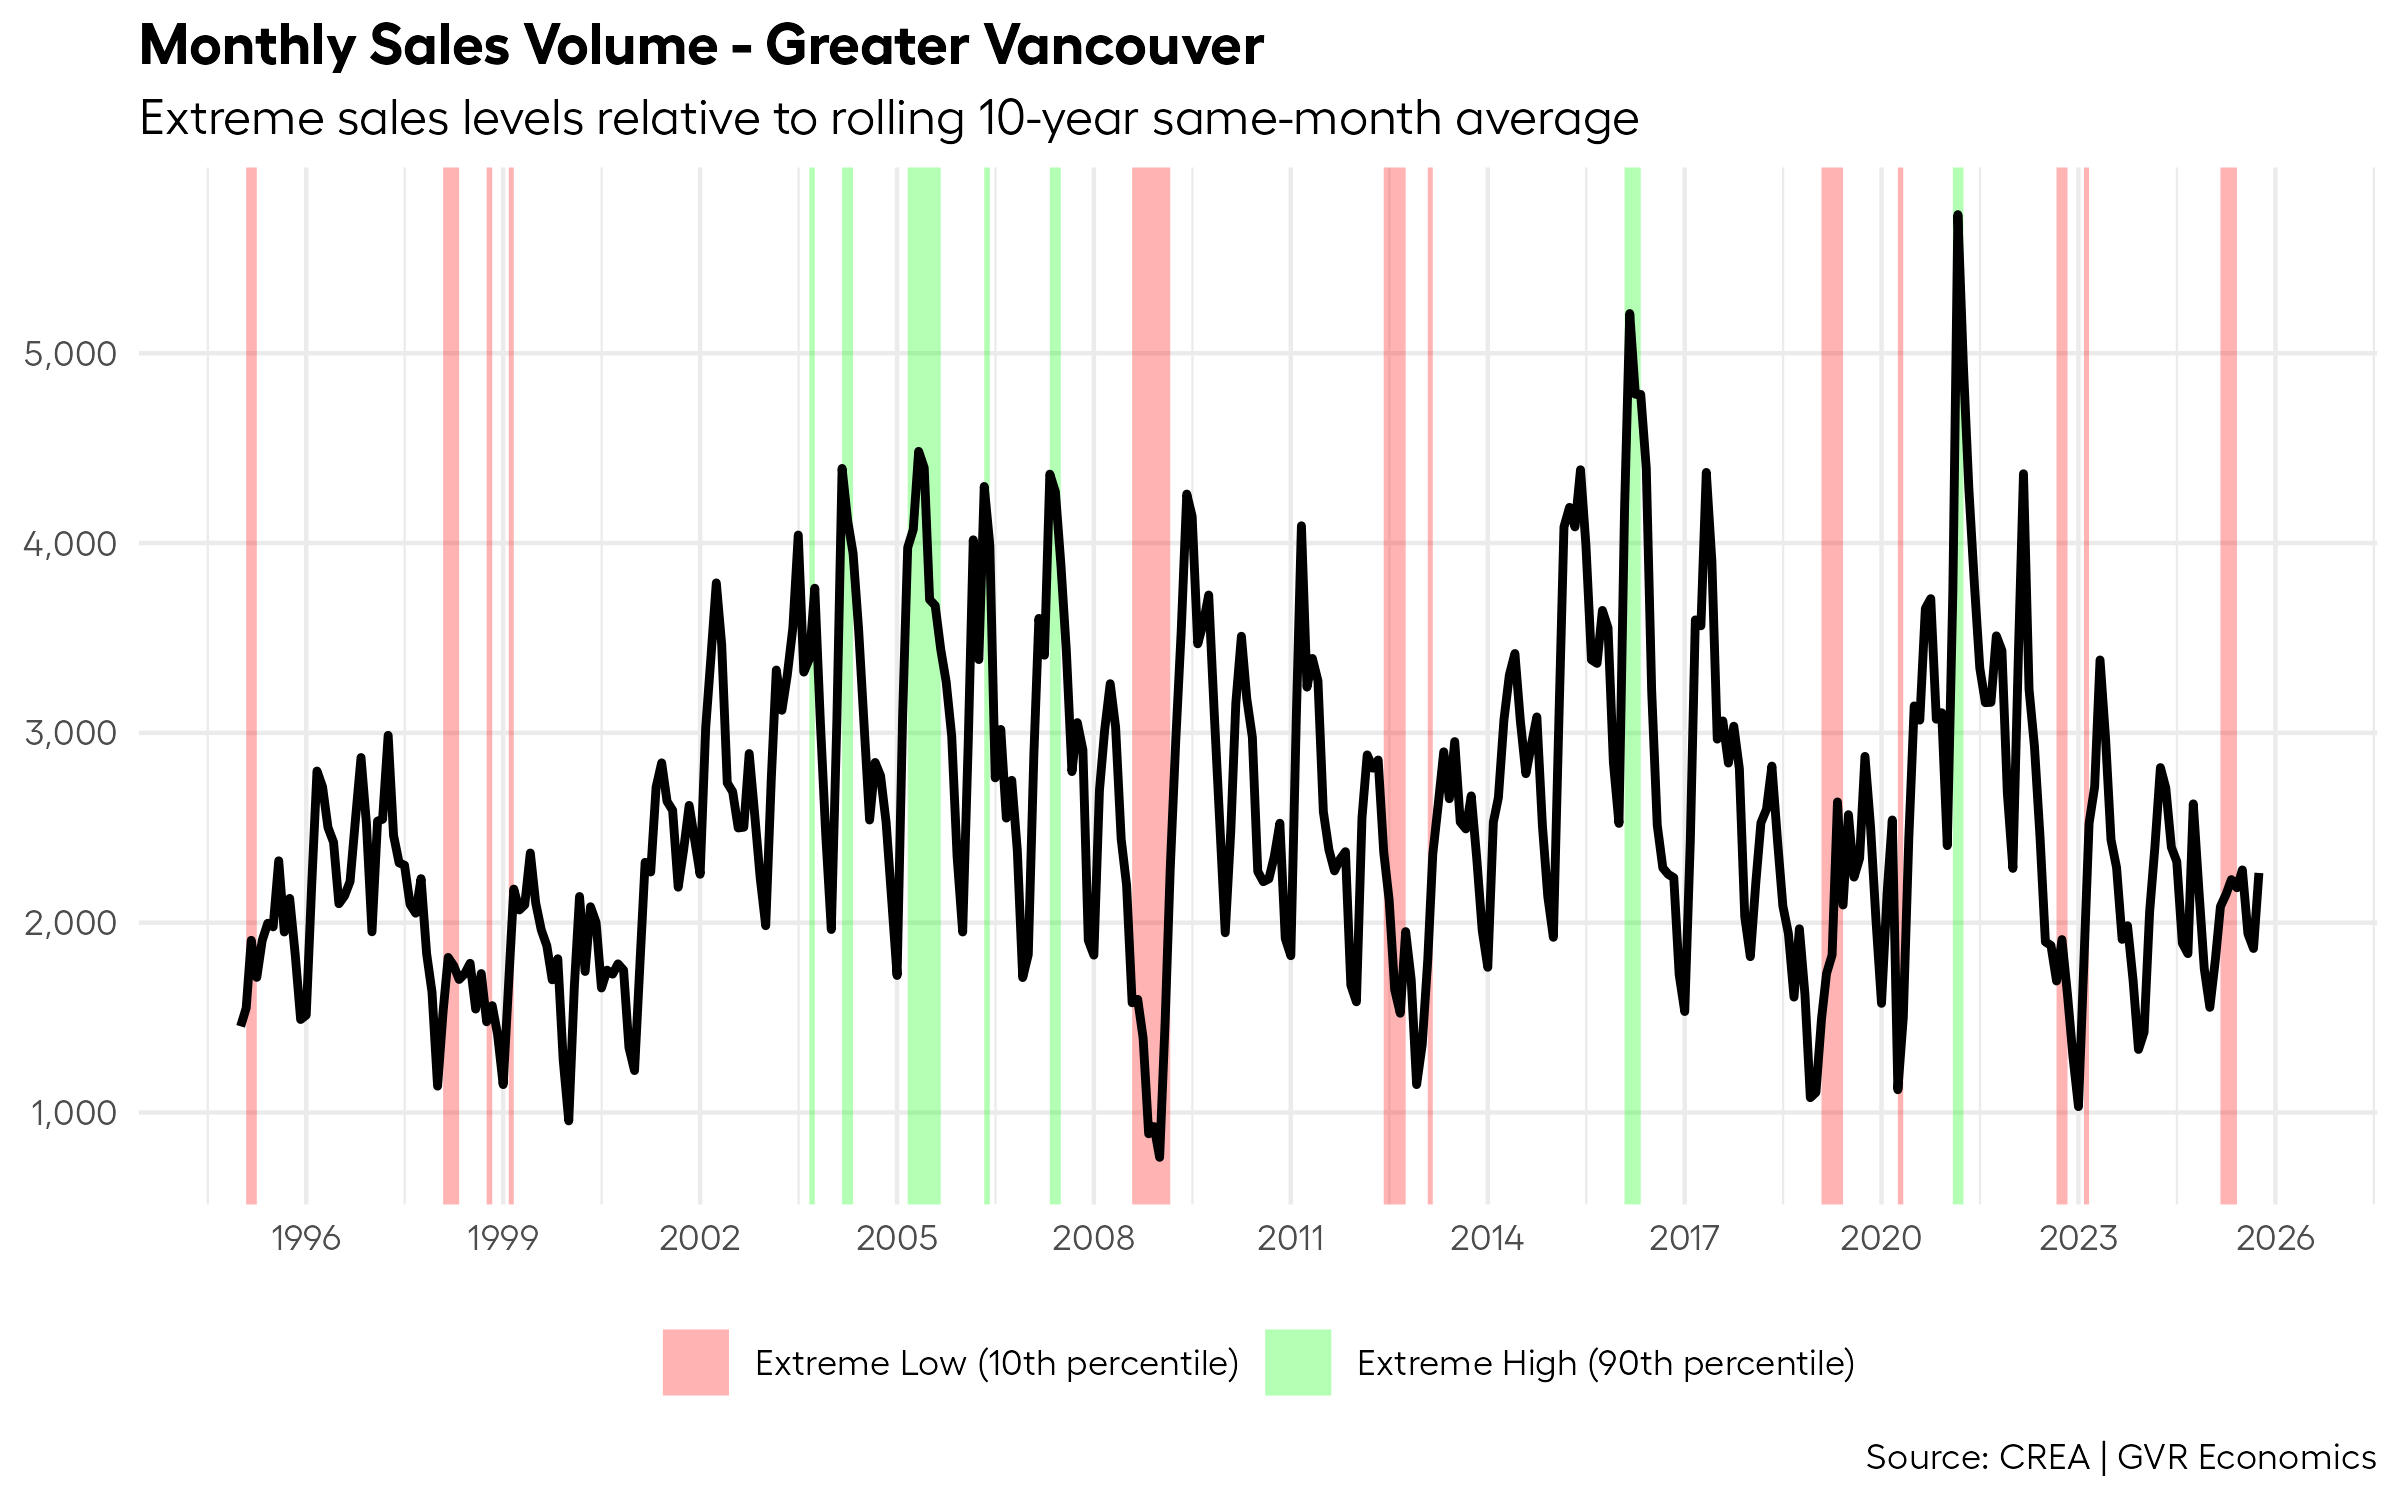
As someone who has keenly observed the dynamics of the Vancouver market for many years, I think this simple algorithm for identifying extremes lines up pretty well with my personal sense of market history.
Supply
Let’s continue by identifying periods of time where inventory levels were abnormally high or low, to help us understand when supply conditions were at historical extremes.
Again, for simplicity, we’ll use the same methodology as we did for the sales data, but this time we’ll feed in the historical data for inventory levels instead:
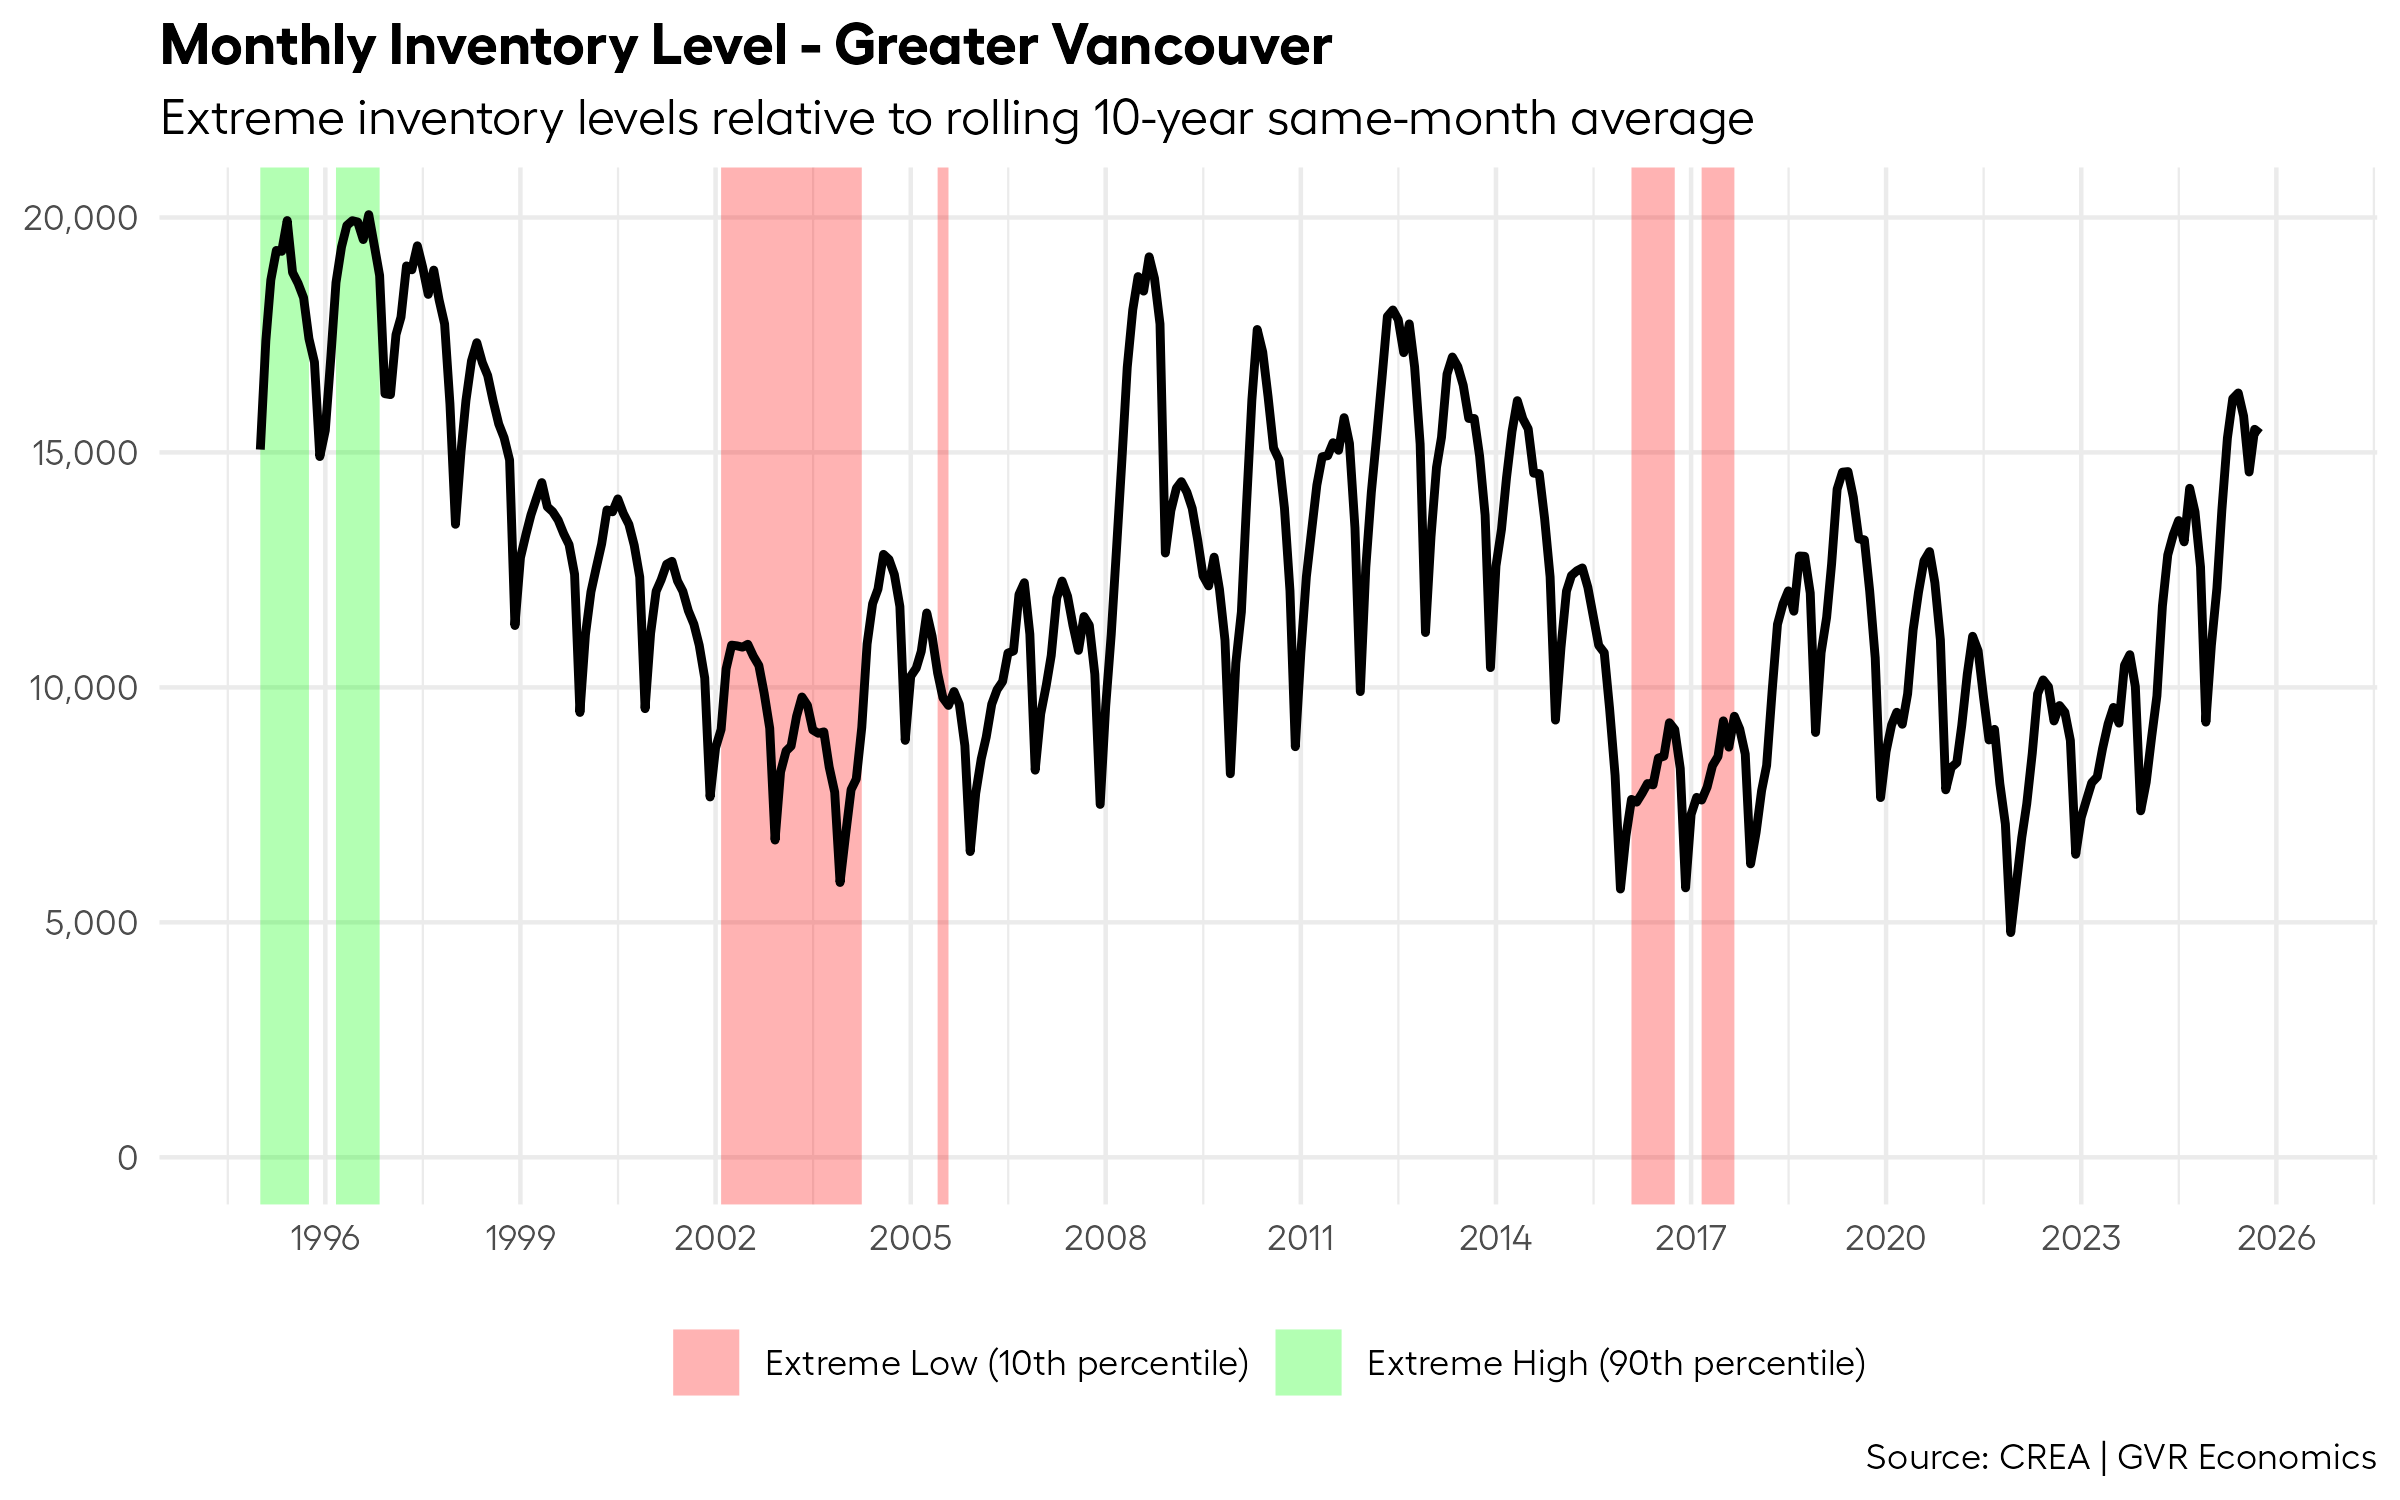
Interestingly, from a supply perspective, there are far fewer periods identified as being “extreme” than there were for sales.
But being somewhat generous and eyeballing it, the plot lines up fairly well with my sense of the market’s history.
For example, the period in and around 2016/2017 is correctly identified as a period of extreme low inventory by the algorithm.
Those of us who’ve been around long enough will likley remember those years as being particularly extreme. Bidding wars were the norm back then as result of record low levels of inventory.
I could easily argue that this period of extremely low inventory formed the impetus for many of the heavy-handed policies aimed at “cooling the market” that various levels of government introduced in subsequent years.
Prices
Let’s continue by identifying periods of time where prices were either rising or falling at an abnormally high or low pace.
Again, for simplicity, we’ll use the same methodology as we’ve been using up to this point, but we’ll feed in the historical price level data instead:
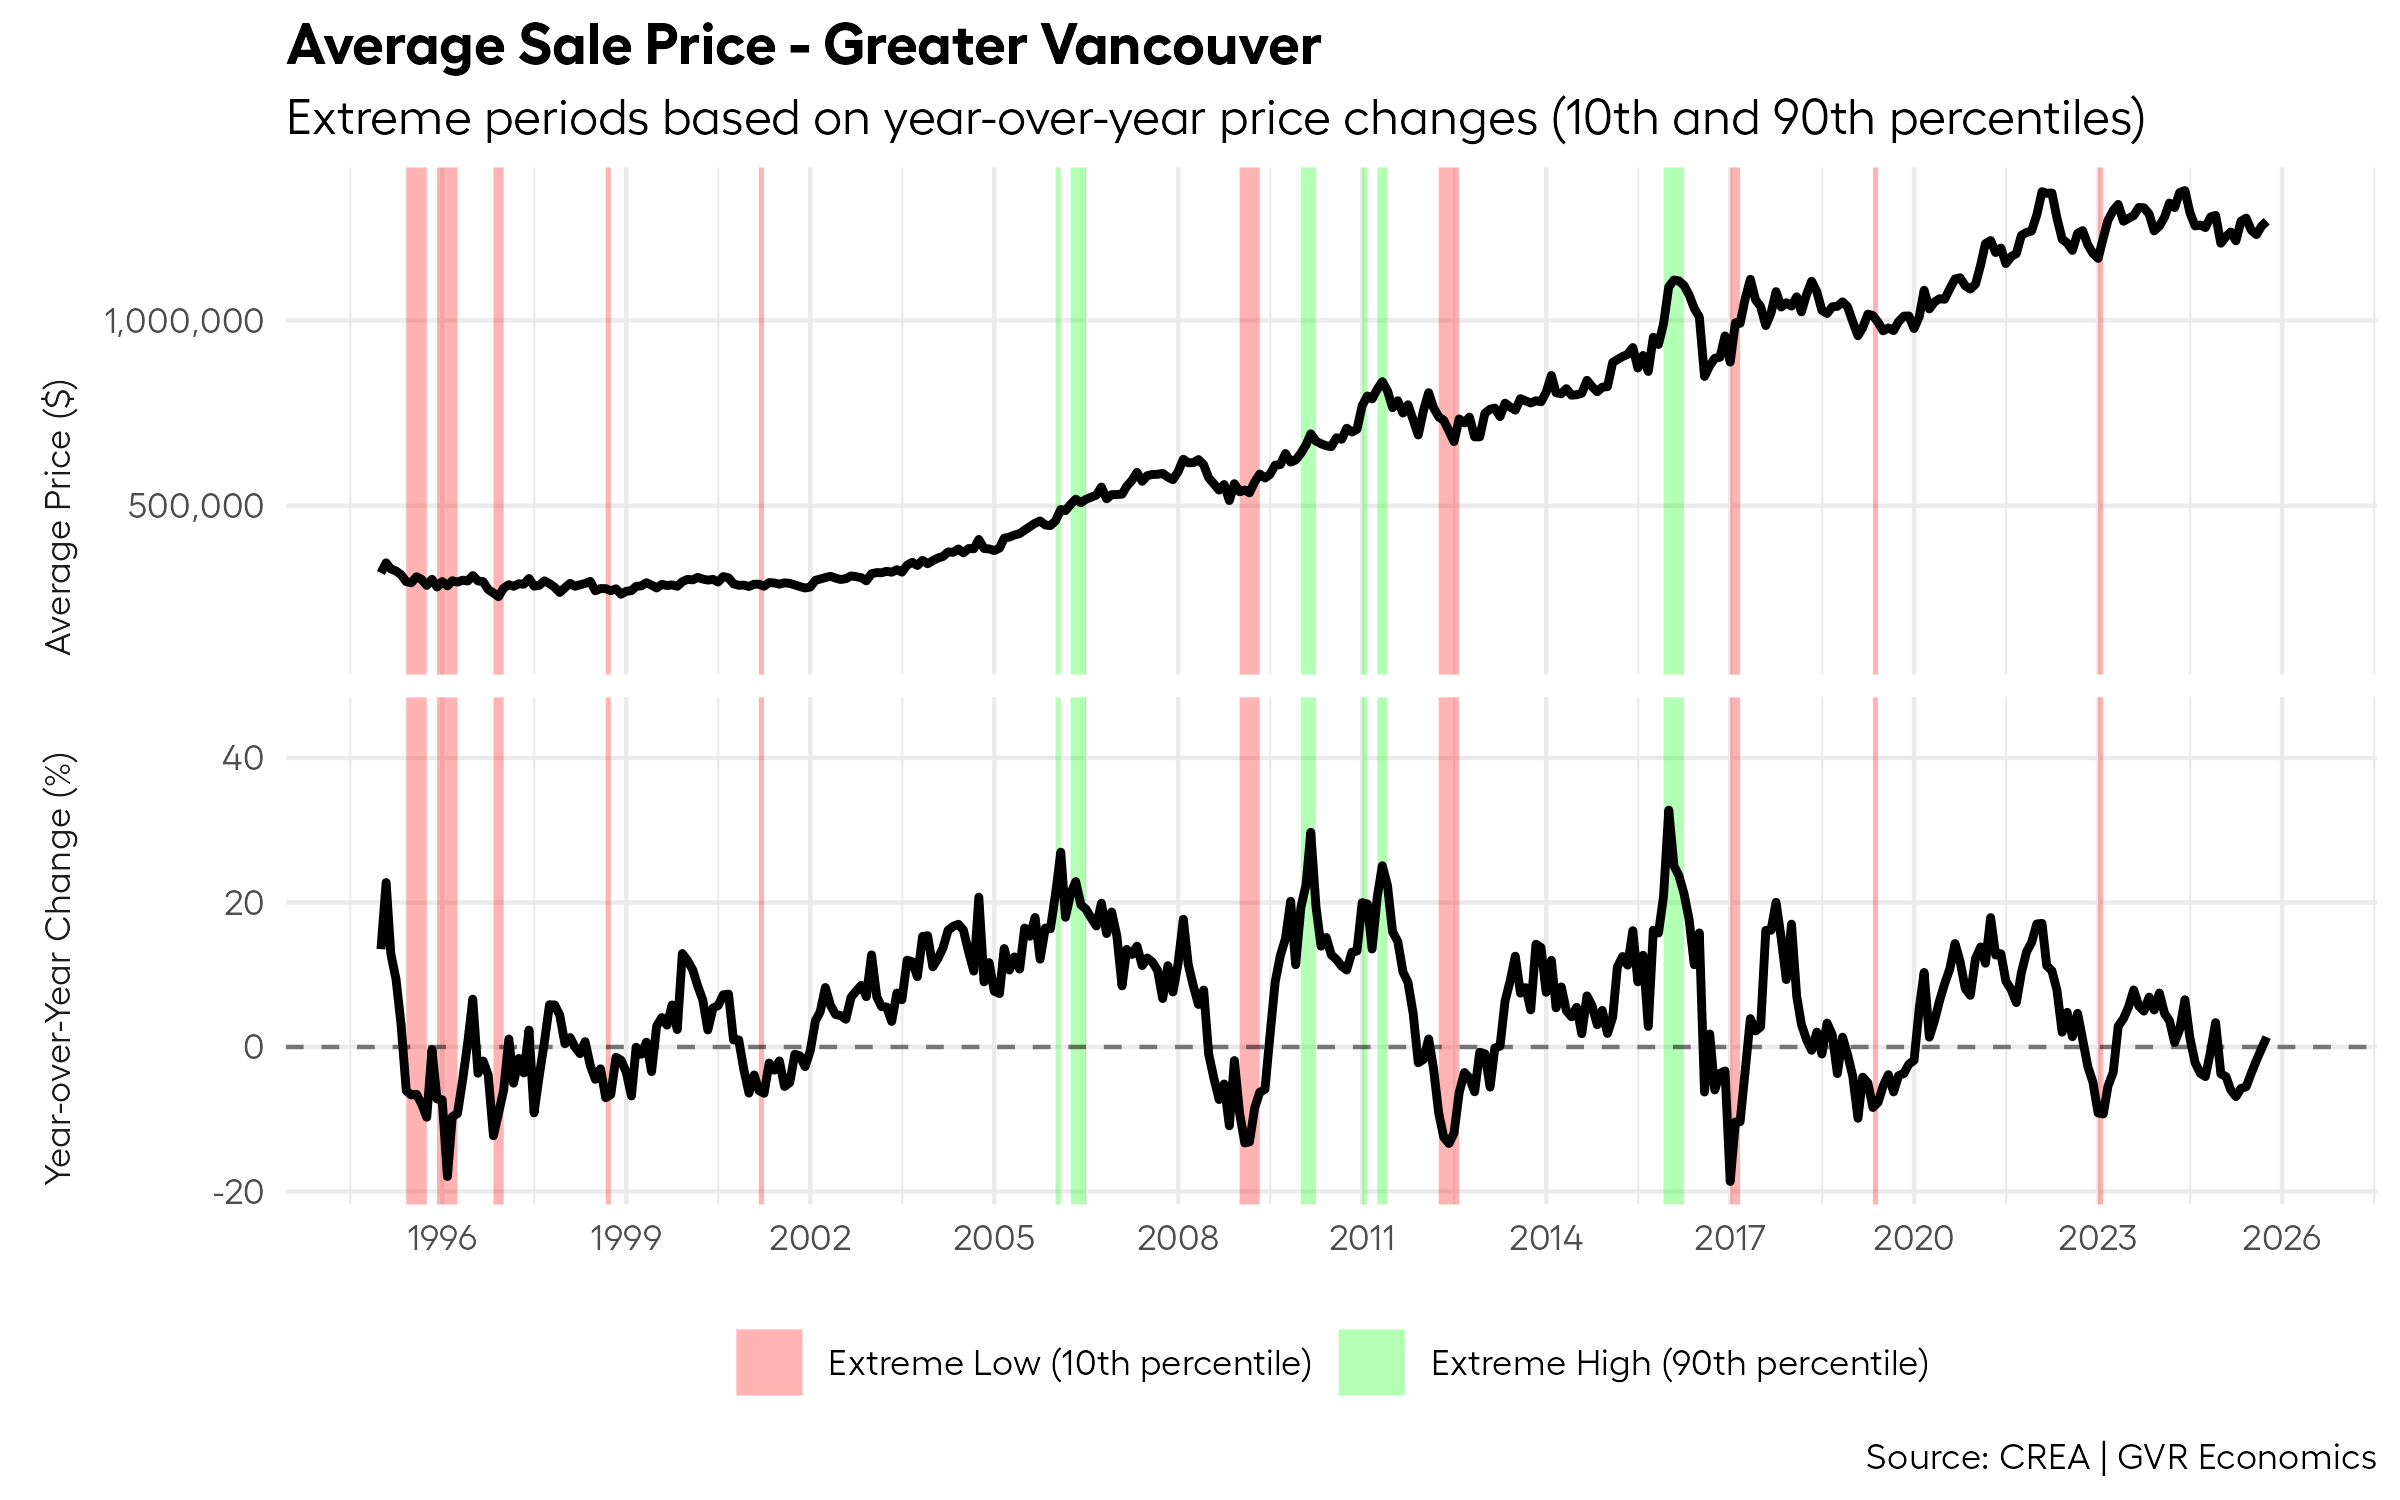
Looks sensible to me.
The algorithm correctly identifies periods where the market was quite frothy, as well as those where prices turned south, such as in and around recessionary periods.
Speaking of which…
Recessions
It shouldn’t be too controversial to say that periods of time where Canada was experiencing a recession were not “normal”, so we should probably flag these periods of time in our analysis as well.
Here, we don’t need any special algorithm – we just need to look up the list of dates that were associated with recessions in Canada.
Here’s what that looks like plotted against sales data:
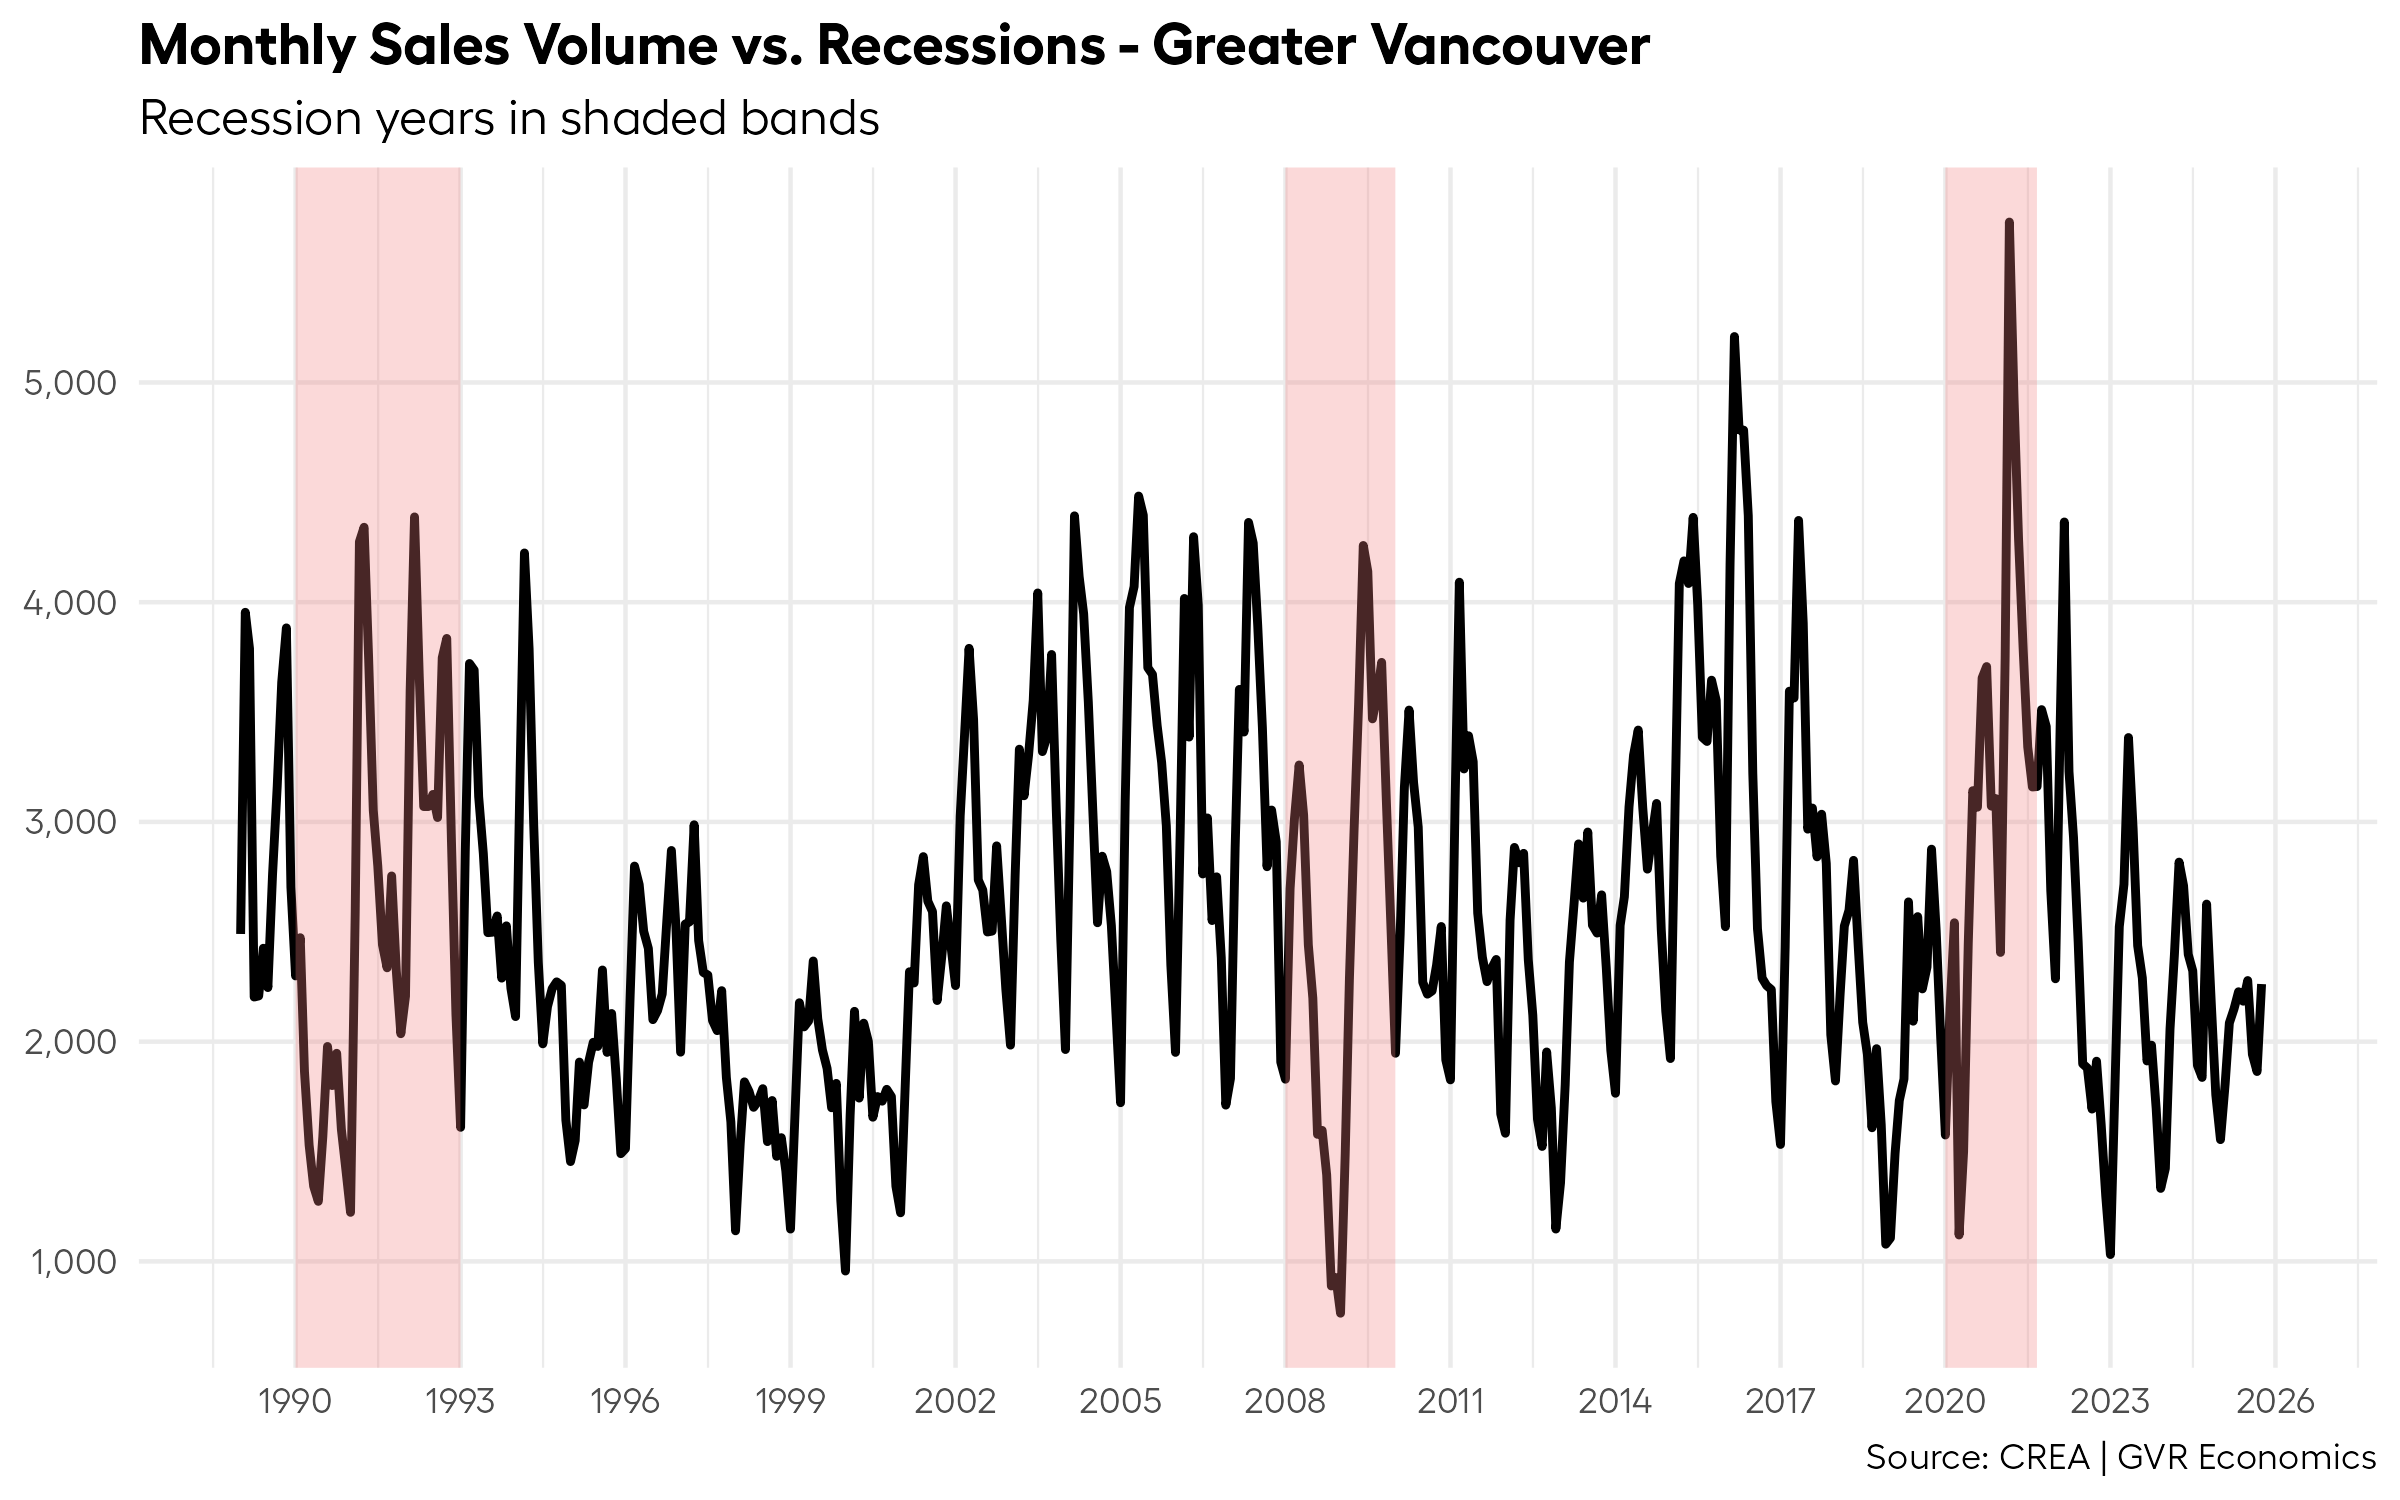
One of the things that usually goes hand-in-hand with recessions, which also impacts the housing market, are changes to interest rates.
When recessions occur, central banks tend to lower interest rates, sometimes quite dramatically, in order to try and cushion the blow to the economy.
But this policy choice also tends to result in significanly lower borrowing costs, which sometimes, can spur on sales activity.
So, let’s take a look at that next.
Interest Rates
It’s also important to point out that recessions aren’t the only thing that can significantly impact interest rates.
Wars, trade policy, and a myriad of other global macroeconomic factors also influence the cost of borrowing money at any given point in time.
With that in mind, it’s worth also flagging historical time periods where interest rates, and by extension, mortgage rates, were abnormally high or low.
This will give us a sense of the historical state of credit conditions, which we know have important pass-throughs to the housing market.
To do that, we’ll return to our trusty algorithm and feed in historical conventional five-year fixed mortgage rate data as a proxy for borrowing costs over time:
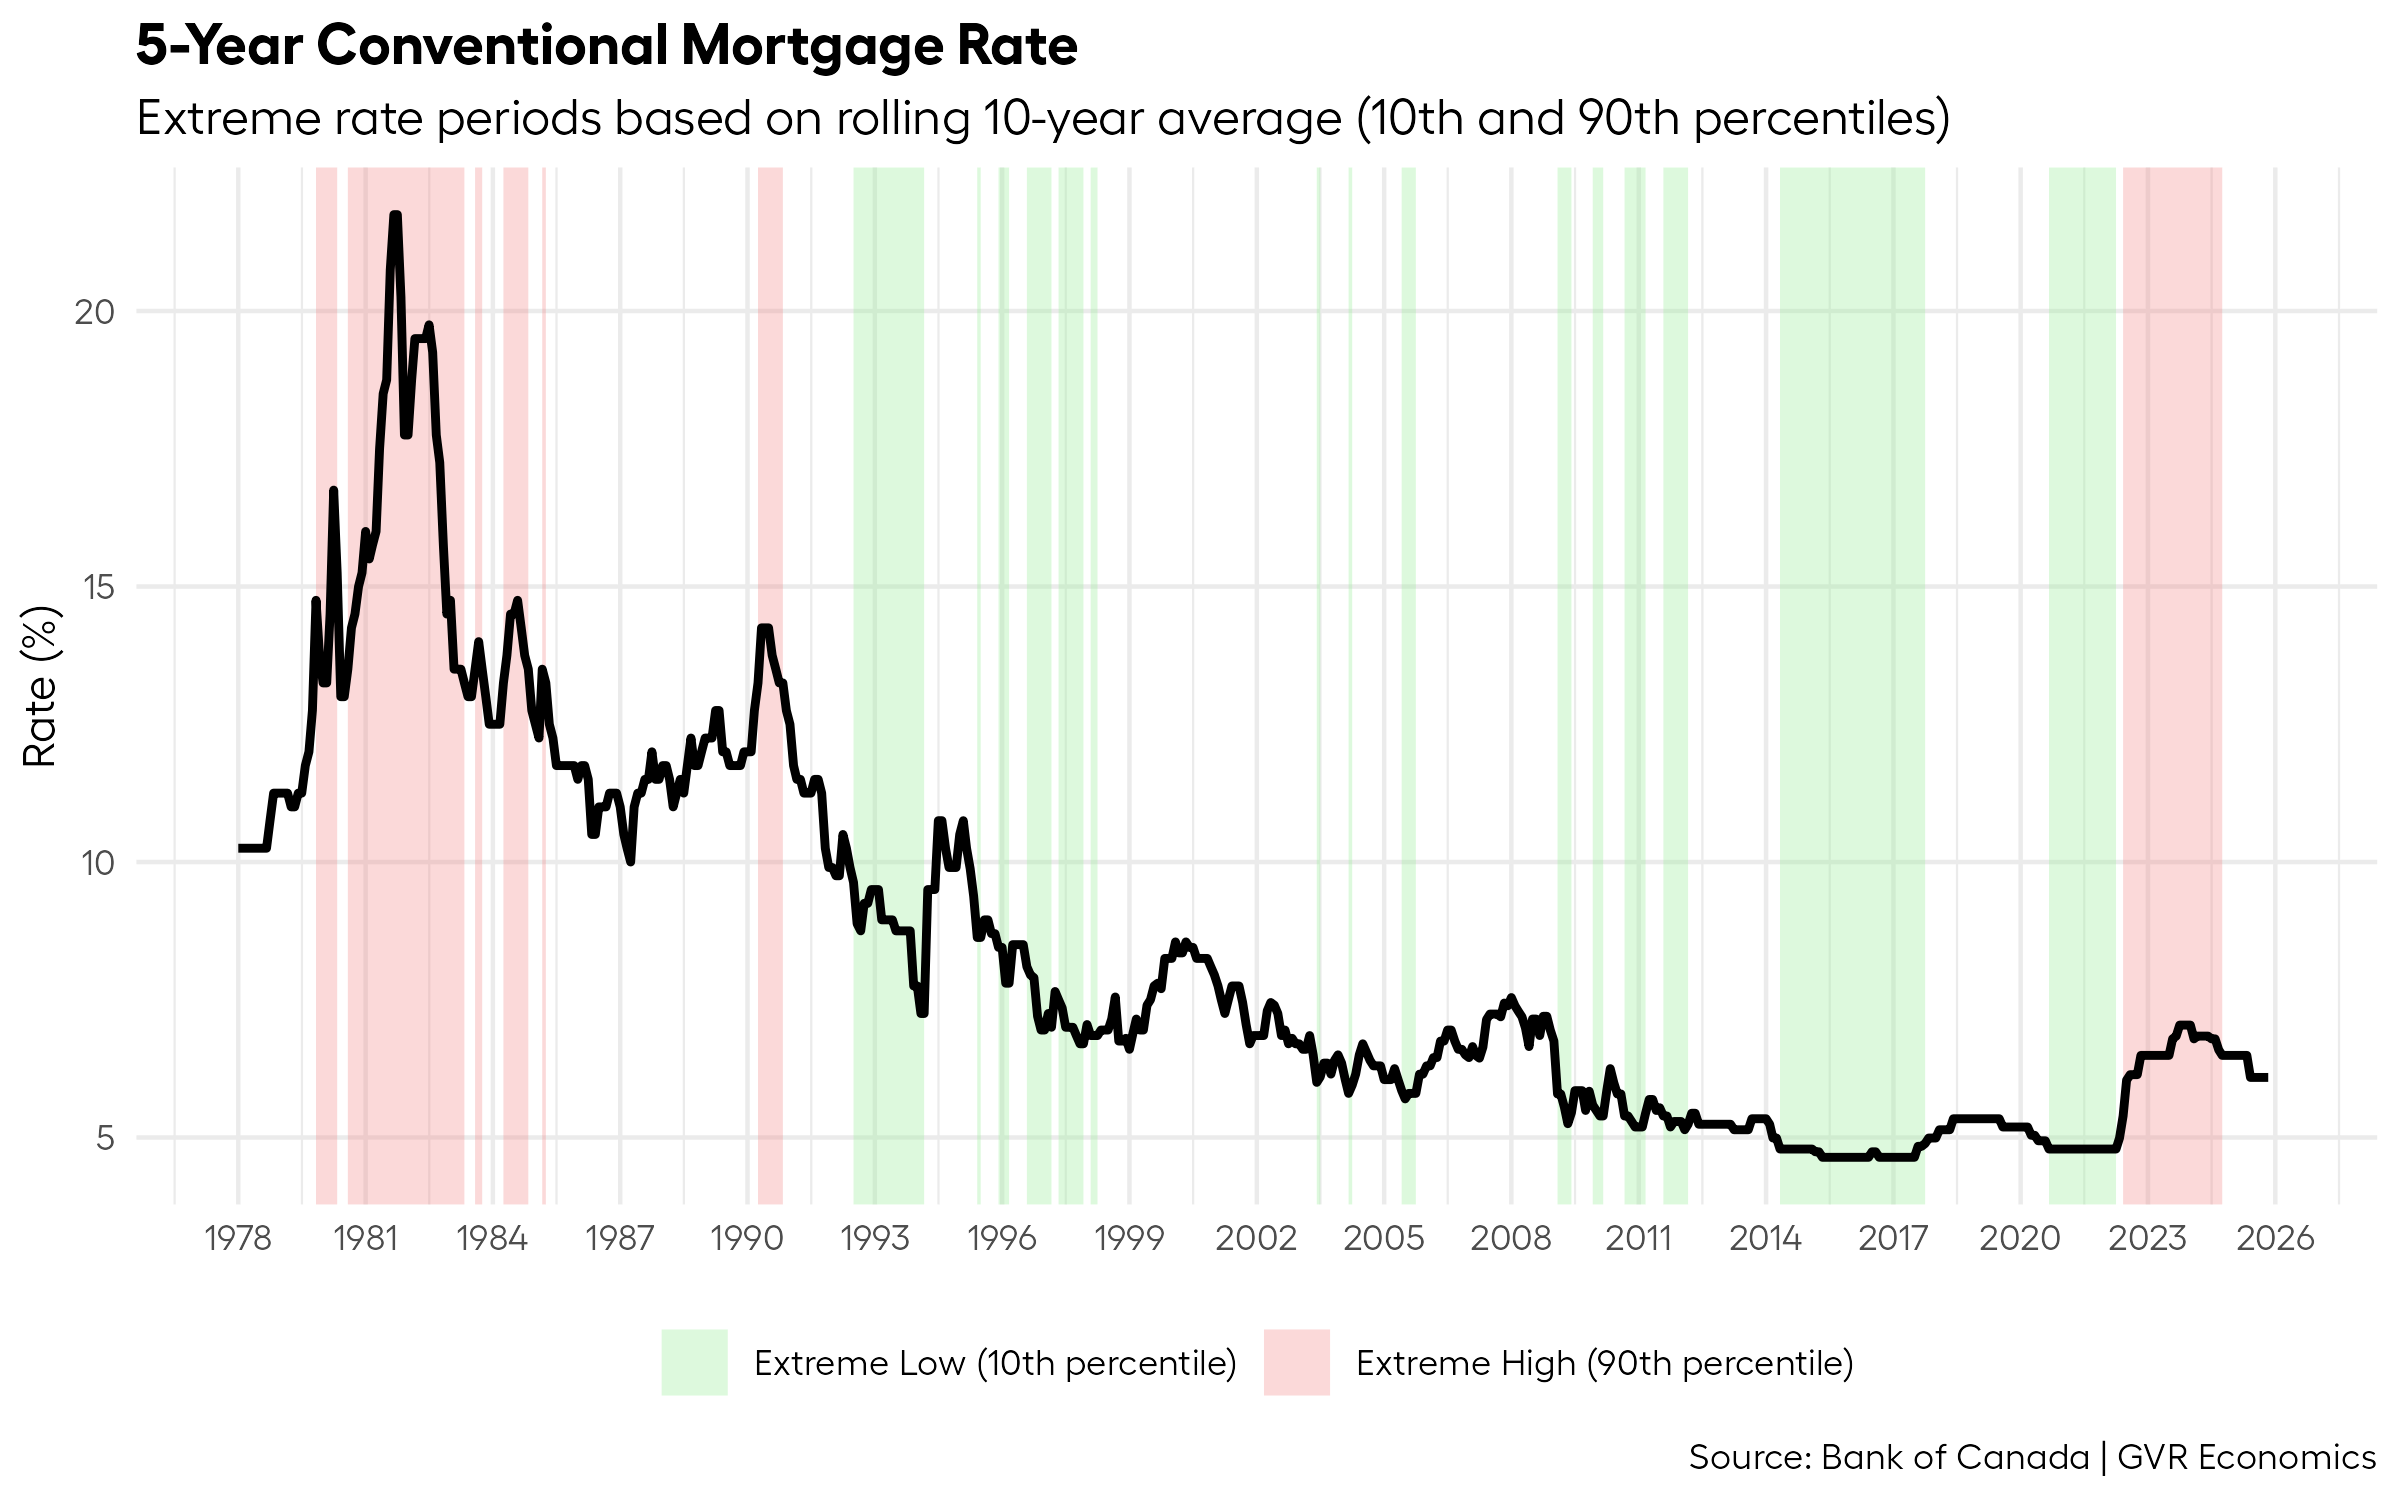
Again, a pretty sensible set of identifications by the algorithm.
Periods where credit conditions were exceptionally tight (such as in the past five years or so) were correctly identified, and periods where the cost of money was abnormally cheap relative to the past ten years seem to be highlighted successfully as well.
Policy
Finally, let’s take a crack at identifying periods of time where policies came into effect that had the potential to impact the housing market.
This is a much trickier task to do than what we’ve done so far, as it relies on a sense of subjectivity, which is tricky to translate into a simple algorithm.
It’s always a matter of debate as to whether various policies targeting the housing market did, or did not, have any impact.
It’s also difficult to measure how long a policy impacted the market, or when precisely the start and end of the impact occurred (if any).
So, to try and balance the desire to identify periods of history where policy changes impacted the market, with the significant challenge of doing so accurately, we’ll need to define an arbitrary algorithm.
To start, we’ll consider any major policy announcement that should have a direct impact on the housing market or on lending standards a “policy event” for our purposes.
Then, to define a duration, we’ll say that a period of six months after the policy announcement or implementation will be the “effect period”.
I know this isn’t going to perfectly capture the impacts, and this arbitrary methodology is less than ideal.
Like I said, this is a very tricky aspect to analyze – trade-offs need to be made.
It’s also worth pointing out that policies can take a bit of time to have any impact (if at all), so the six-month window feels like a reasonably long enough length of time where we’d expect to see an impact, but not so long that we’re only seeing faint evidence of impacts.
Again, it’s a trade-off and it’s not perfect, but for the purposes of this analysis it’s probably sufficient.
Here’s a plot of what that looks like:
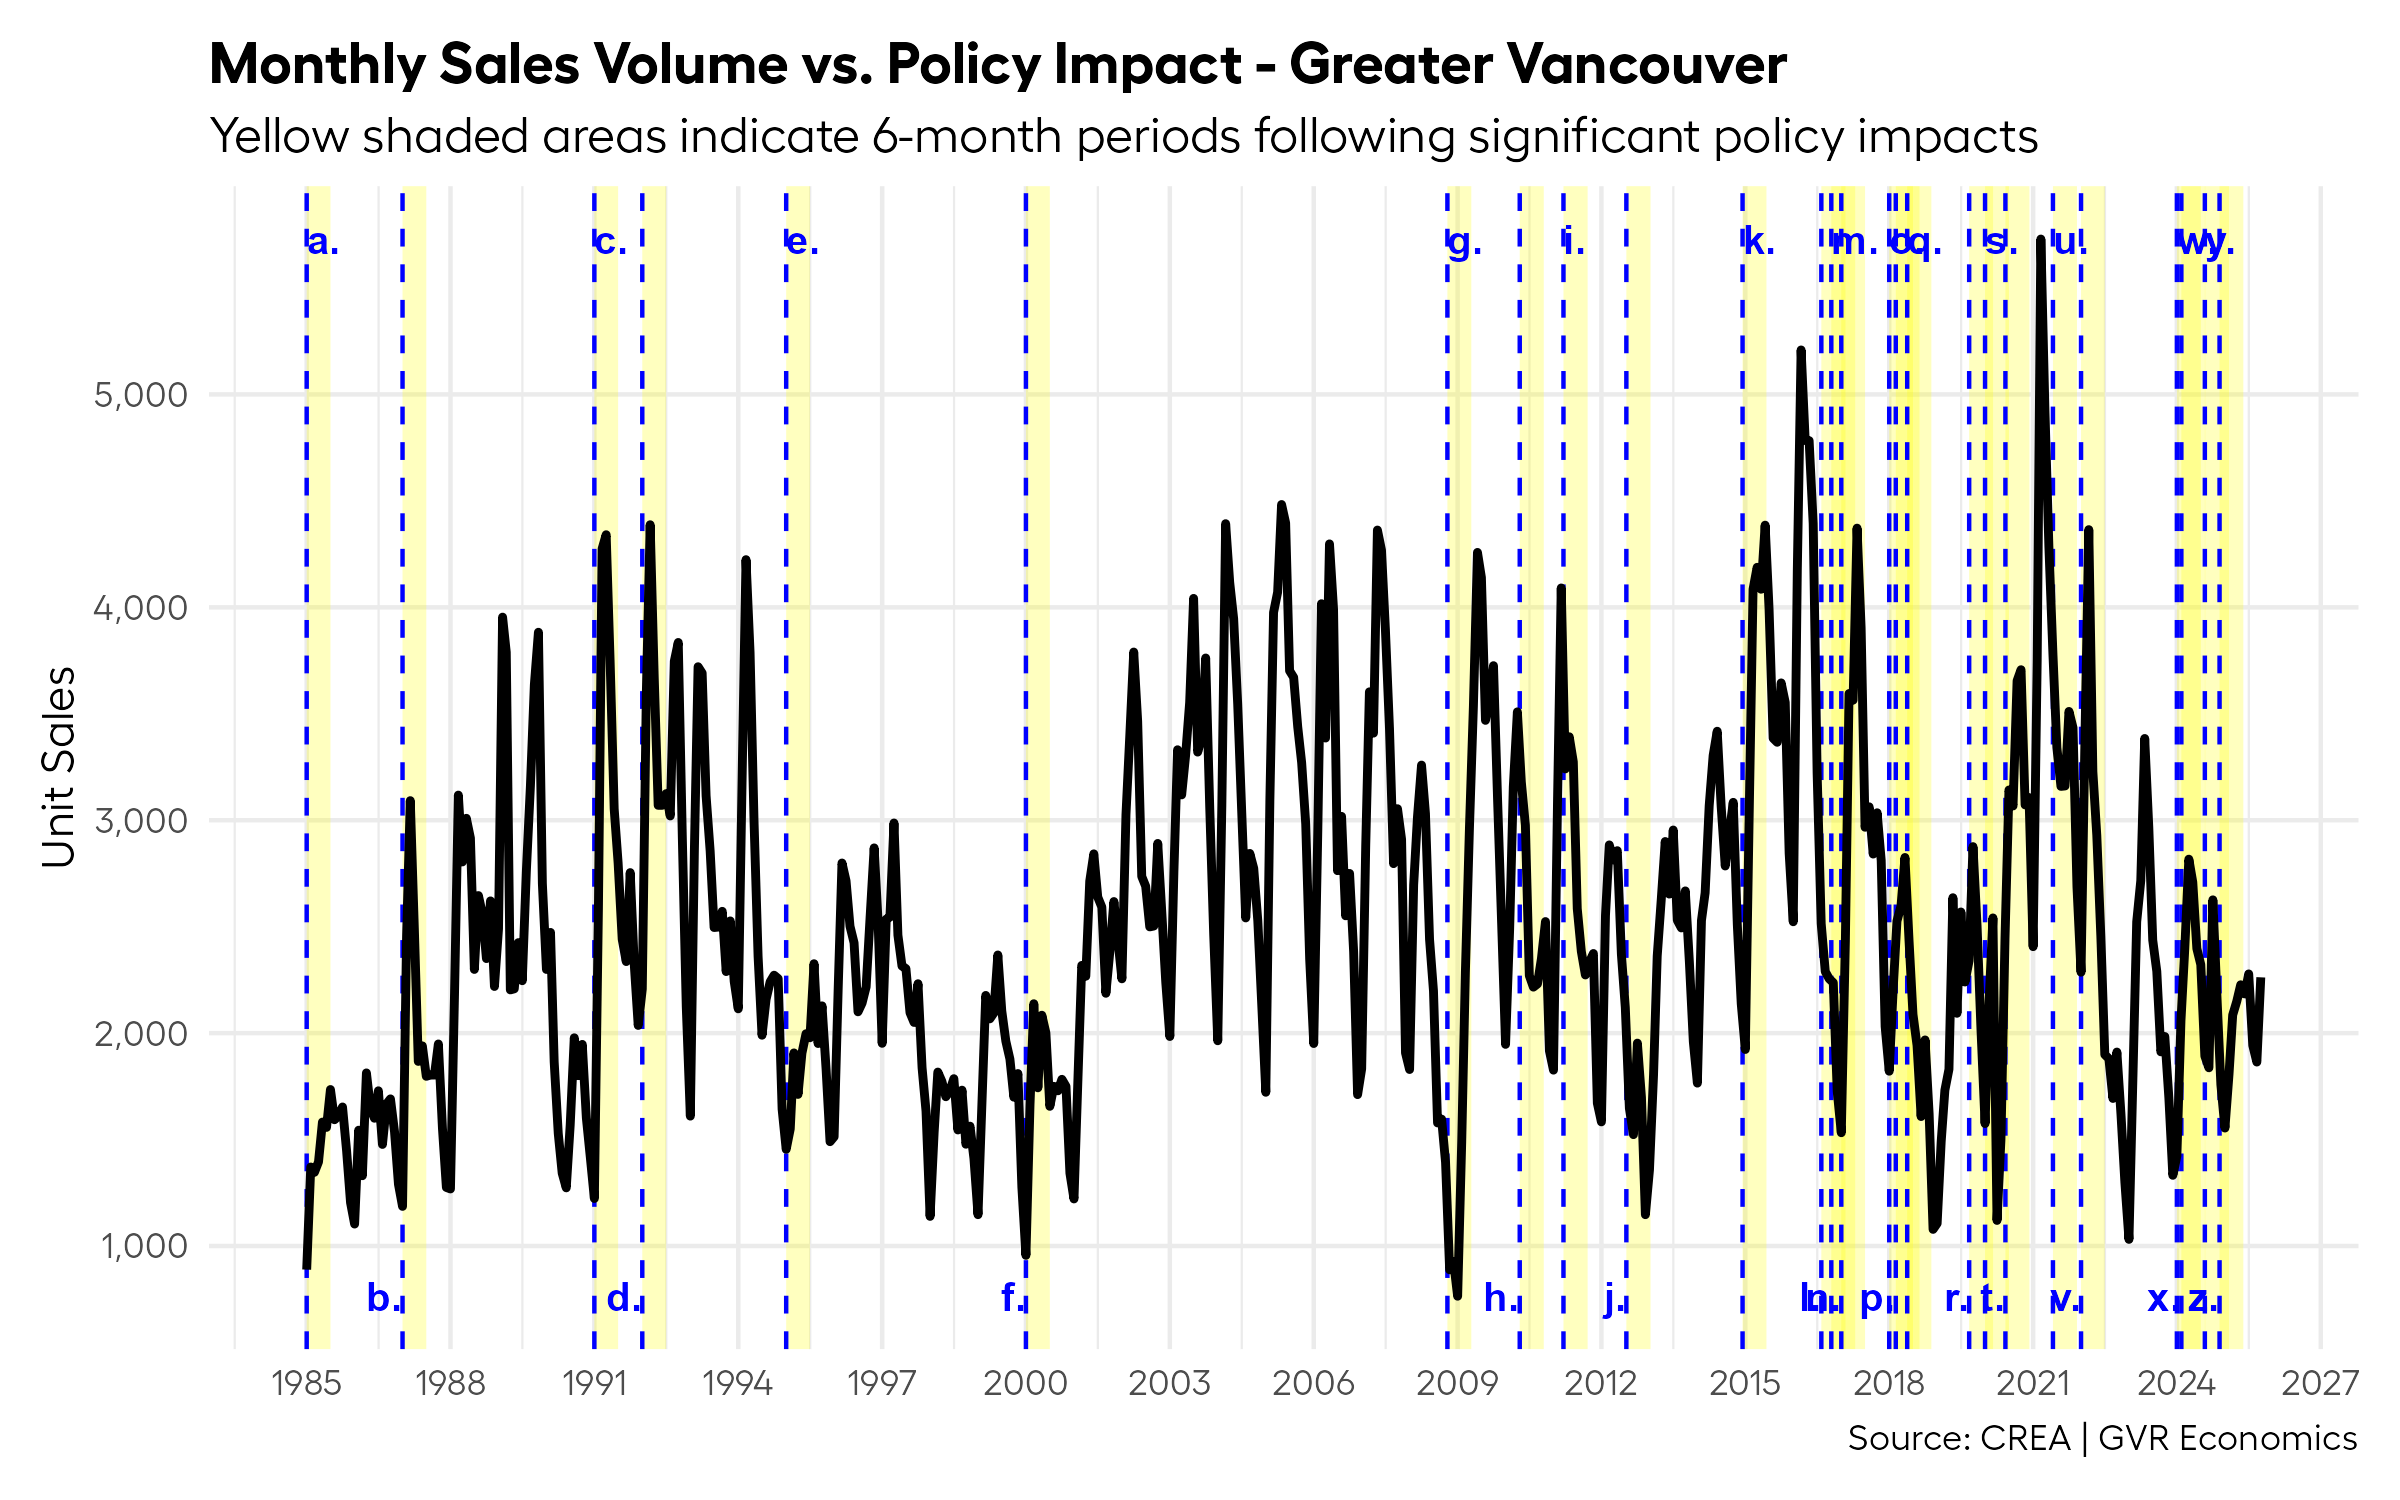
This is a tricky thing to plot so I’ve had to label the policy events with letters to make it readable. For those interested, the full list of policy events I used here are provided in the appendix.
That said, even using this crude algorithm, we can literally see the significant increase in policies targeting the housing market piling up in the last ten years or so.
And realisitically, I probably missed a bunch of important policies on the list as well – it’s tough to track them all down!
All together now
At this point, you might be wondering what a plot might look like if we somehow took all these periods of time that we’ve identified that represent “extremes” of one form or another and put it all on one plot.
If that’s the kind of thing that tickles your fancy, boy do I have a plot for you!
Here it is folks, in all its glory:
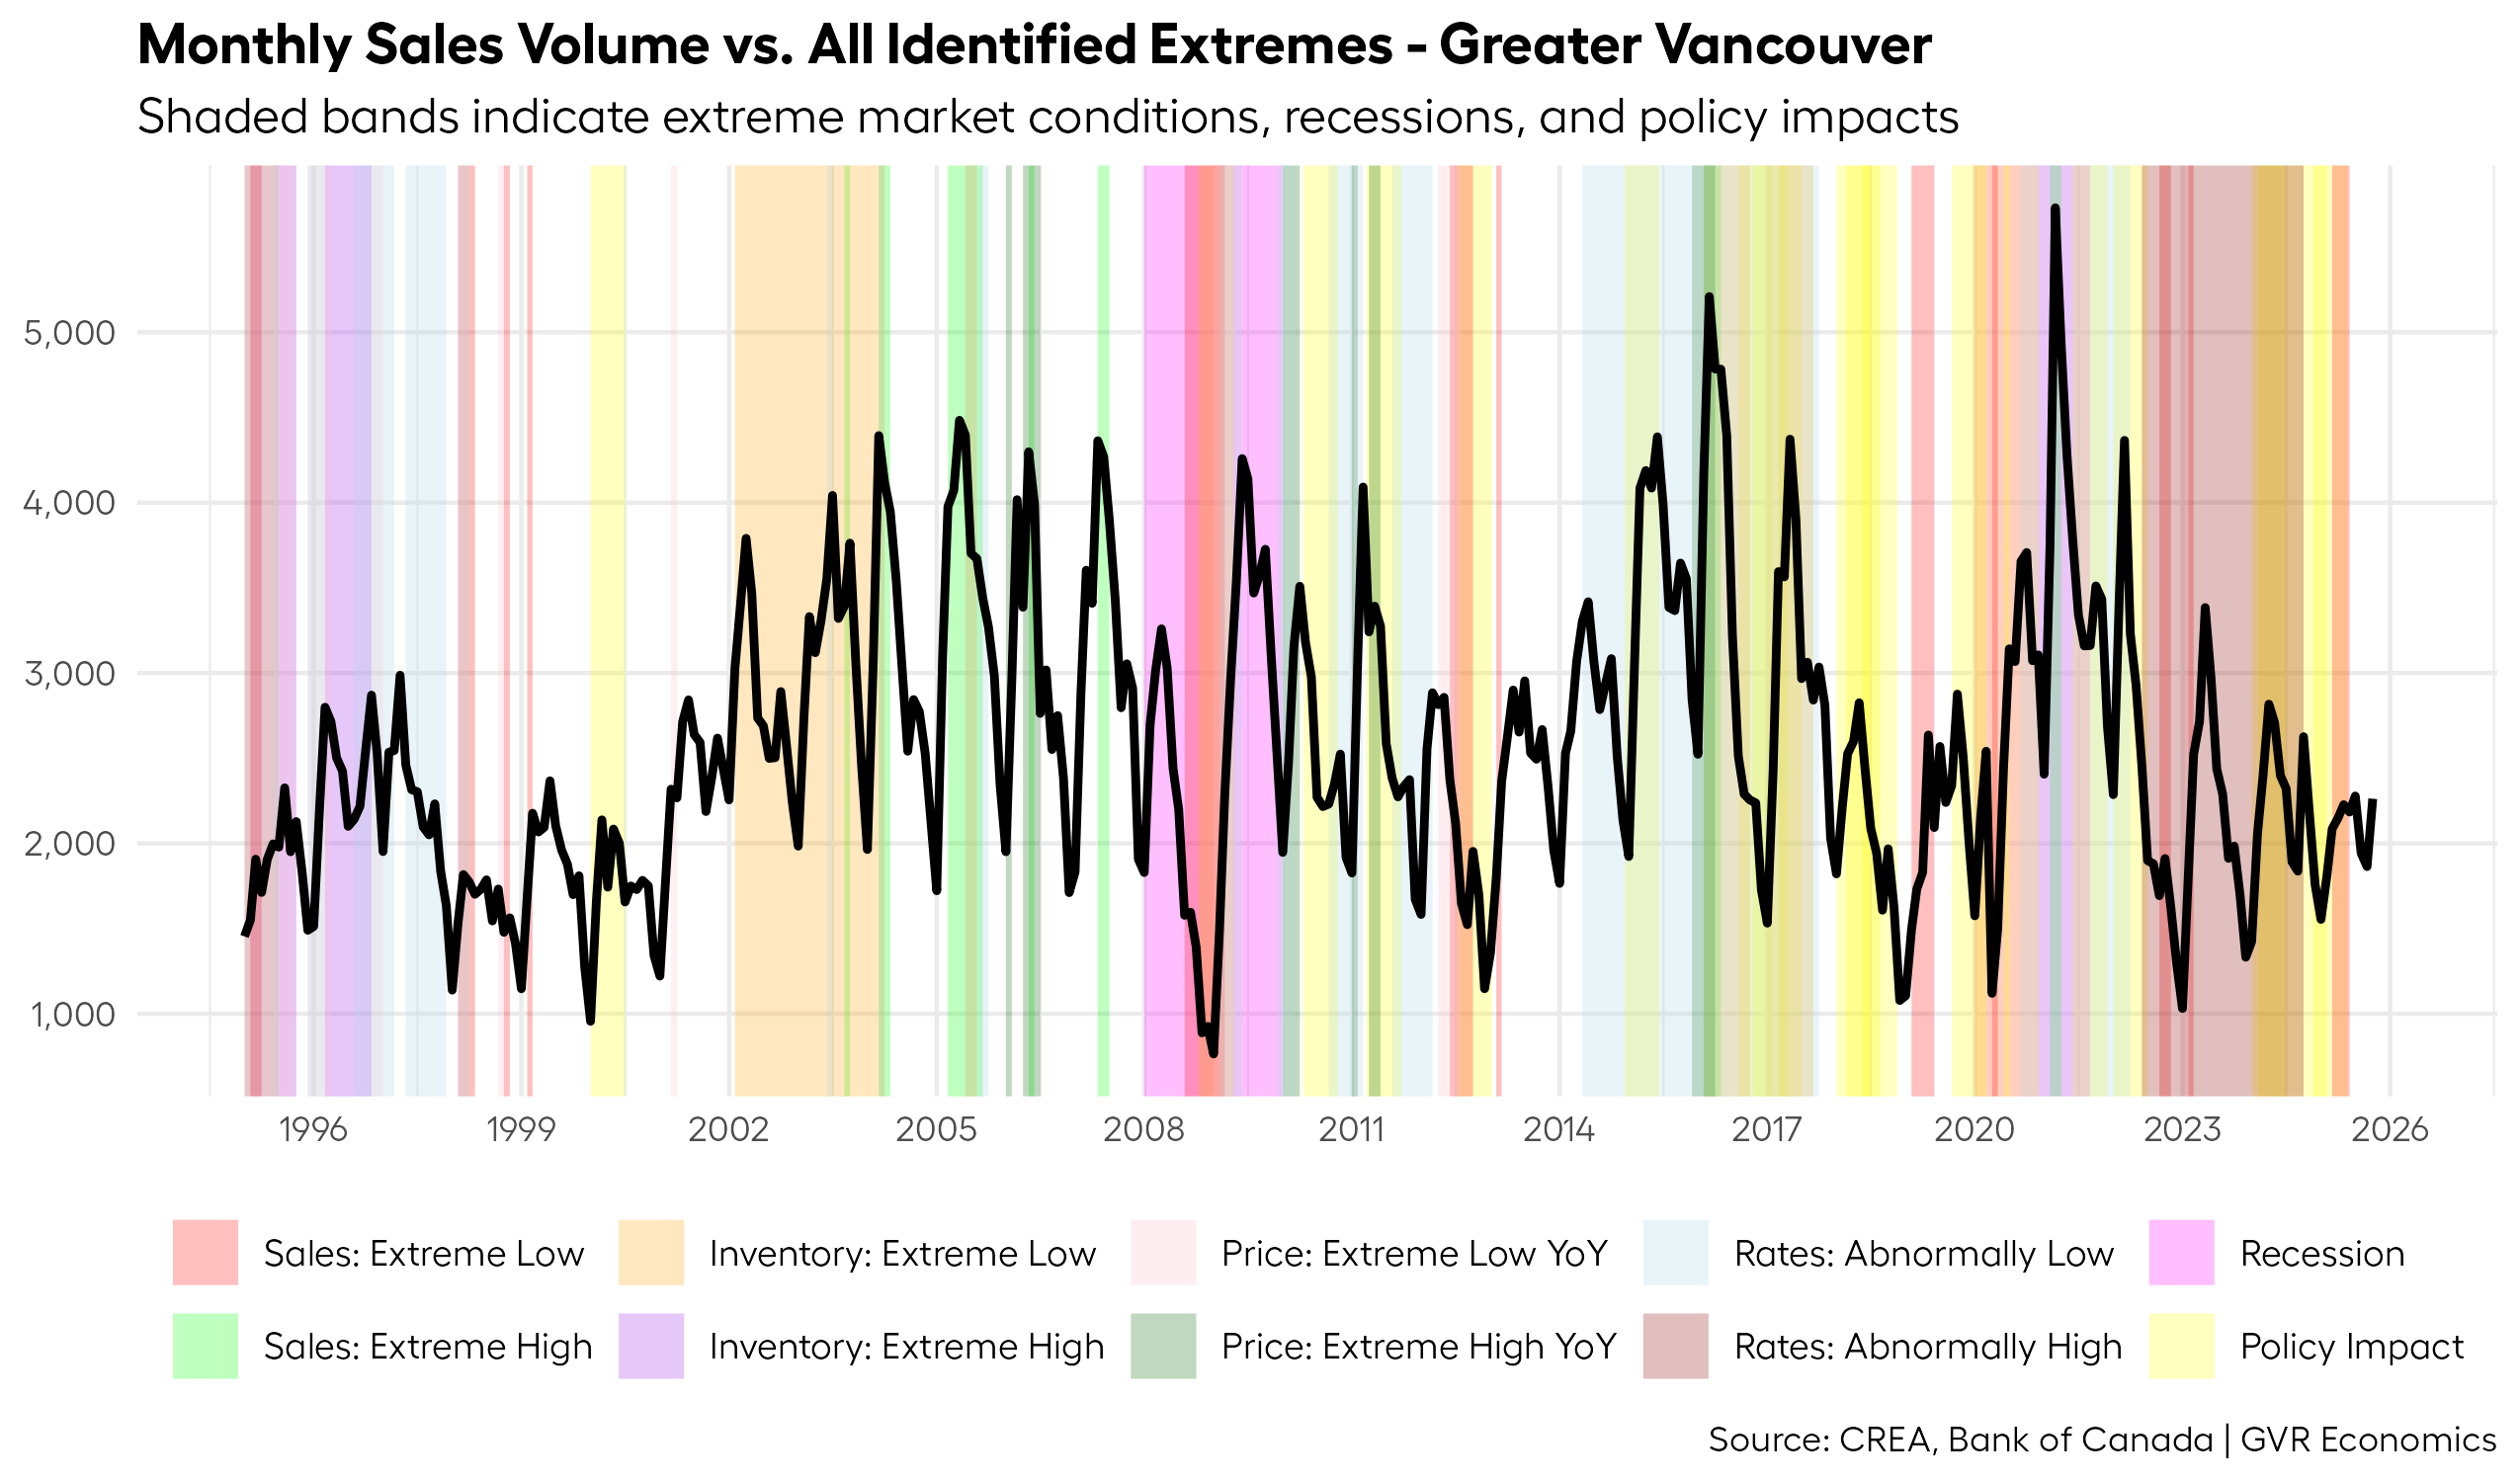
This is wild, right?
What this plot says, is that outside of a few brief windows of time around 1999/2000-ish, and around 2013/2014-ish, there has rarely been a time we could consider the market “normal”.
Interestingly, the most recent few months of data on the plot are not highlighted, which suggests that right now, things are about as “normal” as they can be.
But I may have missed some important factors which could be impacting the market right now (*cough* Trump *cough*).
So, maybe the current market isn’t as “normal” as it could be?
It’s a bit of a tough call.
Final word
I always love when a simple question prompts such an interesting analysis.
To the audience member who posed this question: thank you, and keep on asking the (seemingly) simple questions!
I hope this piece provides readers with some perspective as well.
For many on the sales side of the business, it’s been a challenging market this year, no doubt.
So, can we answer the question of when the market is going to get back to “normal”?
I think after all this, it’s probably fair to say that by some measures (inventory, borrowing costs), the market is actually pretty “normal” at the moment.
But when it comes to demand (or, sales), I think the first half of the year was anything but “normal”. I’ve written pretty extensively about my thinking around that throughout the year, so I won’t belabor the point here.
With that said, the past few months have seen sales tracking a little closer towards what could be considered “in the realm of normal”, but it I think we’re still in an adjustment period.
We’ll see what time will tell.
Shameless plug: Stay tuned for our 2026 forecast to see what we think “normal” will look like next year!
Appendix
List of policy events
Here’s the full list of policy events that were considered for this analysis:
| ID | Date | Policy Name | Description |
|---|---|---|---|
| a. | 1985-01-01 | CMHC Rule Changes (1985) | CMHC policy adjustments affecting mortgage insurance eligibility |
| b. | 1987-01-01 | Mortgage Lending Rules (1987) | Federal changes to mortgage lending standards and practices |
| c. | 1991-01-01 | GST Implementation | Goods and Services Tax introduced, adding 7% to new home purchases and affecting construction costs |
| d. | 1992-01-01 | CMHC Policy Changes (1992) | Updates to CMHC mortgage insurance policies and underwriting standards |
| e. | 1995-01-01 | Mortgage Qualification Rules (1995) | Federal adjustments to mortgage qualification criteria affecting borrower eligibility |
| f. | 2000-01-01 | CMHC Premium Changes (2000) | Modifications to CMHC insurance premium structure |
| g. | 2008-10-15 | CMHC Crisis Response (2008) | Emergency policy changes during the financial crisis, including tighter lending standards |
| h. | 2010-04-19 | CMHC Rule Changes (2010) | Post-crisis tightening of CMHC insurance rules, reducing maximum amortization periods and tightening qualification |
| i. | 2011-03-18 | CMHC Premium Increase (2011) | Premium increases making insured mortgages more expensive |
| j. | 2012-07-09 | OSFI B-20 Guidelines | OSFI introduced B-20 guidelines limiting high-ratio mortgages and tightening lending standards |
| k. | 2014-12-11 | CMHC Premium Increase (2014) | Further premium increases, raising costs for buyers with <20% down |
| l. | 2016-08-02 | BC Foreign Buyer Tax (15%) | BC introduced 15% tax on foreign buyers in Metro Vancouver to cool speculative demand |
| m. | 2016-10-17 | Federal Stress Test (2016) | Stress test requiring borrowers to qualify at higher interest rates, reducing purchasing power |
| n. | 2017-01-01 | Vancouver Empty Homes Tax | 1% tax on vacant homes to encourage rental supply and reduce speculation |
| o. | 2018-01-01 | OSFI B-20 Stress Test | Uninsured mortgages required to qualify at the greater of contract +2% or 5.25% |
| p. | 2018-02-20 | BC Speculation Tax | Annual tax on vacant/underutilized properties targeting foreign and out-of-province owners |
| q. | 2018-05-18 | BC Foreign Buyer Tax (20%) | Foreign buyer tax increased to 20% and expanded to additional regions |
| r. | 2019-09-02 | First-Time Home Buyer Incentive | Shared equity mortgage program reducing monthly payments for first-time buyers |
| s. | 2020-01-01 | CMHC Insurance Changes (2020) | Updates to insurance policies and eligibility criteria |
| t. | 2020-06-04 | CMHC Tighter Rules (2020) | Stricter qualification criteria (lower debt ratios, higher credit score), later reversed |
| u. | 2021-06-01 | BC PTT Increase | Higher property transfer tax for properties over $3M |
| v. | 2022-01-01 | Federal Underused Housing Tax | 1% annual tax on underused/vacant residential property owned by non-residents |
| w. | 2024-01-01 | BC PTT Exemption Increase | Higher exemption threshold for first-time buyers |
| x. | 2024-02-04 | Foreign Ownership Ban Extended | Two-year extension of foreign homeownership ban (to 2027) |
| y. | 2024-08-01 | 30-Year Amortization (FTB) | 30-year amortization allowed for FTBs buying new builds (effective Aug 1, 2024) |
| z. | 2024-11-21 | Stress Test Removal (Renewal) | Borrowers can switch lenders at renewal without requalifying under stress test |