Cold open
I’ve been getting quite a few calls from the media lately asking me to comment on the slowdown we’re seeing in the Vancouver market versus that of Toronto, often with a focus on the condo segment.
Apparently, the Toronto market is hitting a pretty rough patch.
Who knew!?1
While sales have been slow in both markets for various reasons2, there have been some notable differences between the two markets.
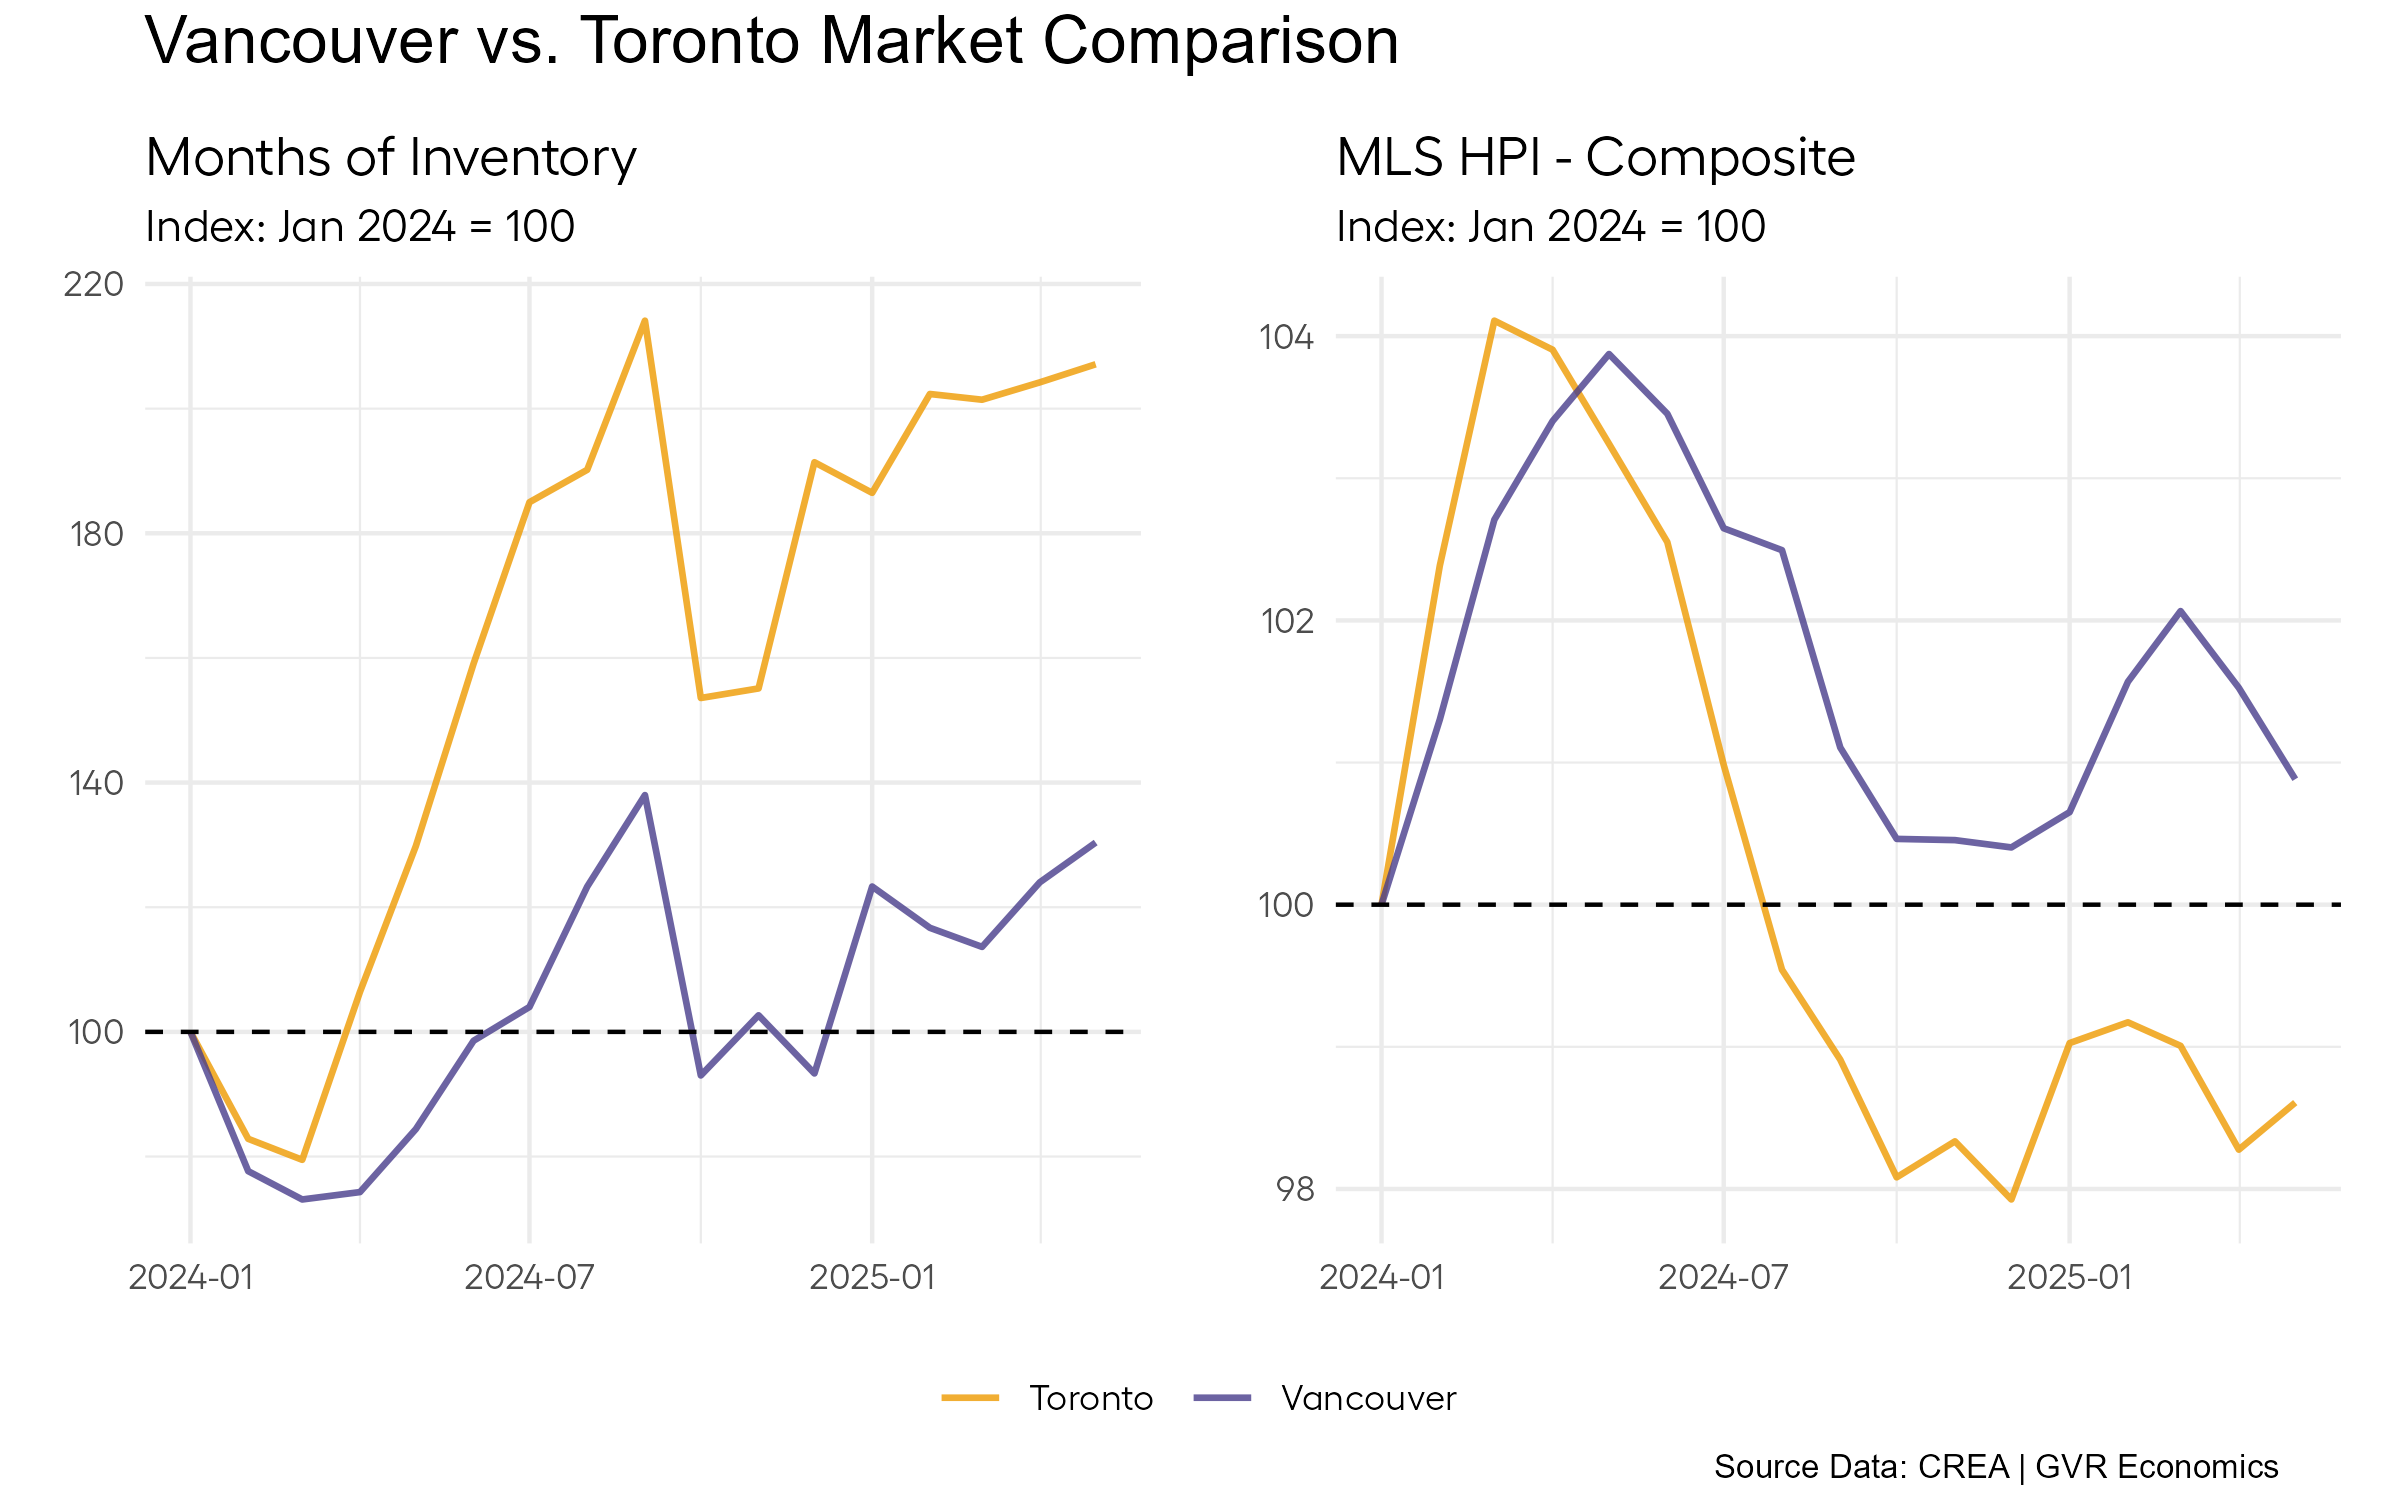
On the inventory side, Toronto has seen a lot of listings pile up (primarily in the condo segment), with months of inventory3 (MOI) roughly doubling since the start of last year.
By comparison, Vancouver’s MOI is only up about 35 per cent or so since the start of last year – which is a far cry from the increase seen in Toronto.
And in Vancouver, we’re seeing inventory increase in similar proportions across market segments rather than being hyper-concentrated in the condo segment.
As you might expect, with MOI rising (in both markets), prices have softened up, though perhaps not quite enough to get sales really moving again.
Despite being down from their peak, in Vancouver, prices are actually still up about one per cent on the composite index4 since the start of last year, while in Toronto they’re down almost two per cent.
But, while it’s interesting to compare and contrast, the real question here that the media (and seemingly everyone) is asking is, “what’s driving this slowdown?”
Tough sell
As a person who likes to try and solve complicated puzzles, I’ve been feeling unsatisfied with the primary explanation coming from most pundits and other economists.
Under the duress of trying to provide an intelligble comment in a ten-second soundbite to media, I’m also guilty of (begrudgingly) offering up a half-hearted explanation along the lines of:
“It definitely could be related to all this ‘uncertainty’ out there in the world, but there also could be a lot of other factors at play.”
Mea culpa.
But deep down, there’s something about the whole story that the slowdown is entirely due to the uncertainty Trump has been creating with the on-again / off-again trade war(s) that just doesn’t sit right with me.
And it seems every time I dig a little deeper down that rabbit hole, that story just ends up being less and less convincing.
For those who enjoy these ventures down the rabbit hole, this post is yet another attempt to make some sense of it all.
Spoiler alert: it just ends up yielding more questions than answers (for now).
Lightbulb moment
I’m not big on social media, but a few weeks ago, I saw a plot posted by BCREA’s Brendon (Ogmundson) that caught my eye, which got me back into digging deeper into this market slowdown question again5.
Below is a similar plot to his, where he compares the price level across various regions to sales (indexed to Dec. 2024), but I’m using the difference in sales relative to their 10-year seasonal averages6, just to see if it might add any additional insight.
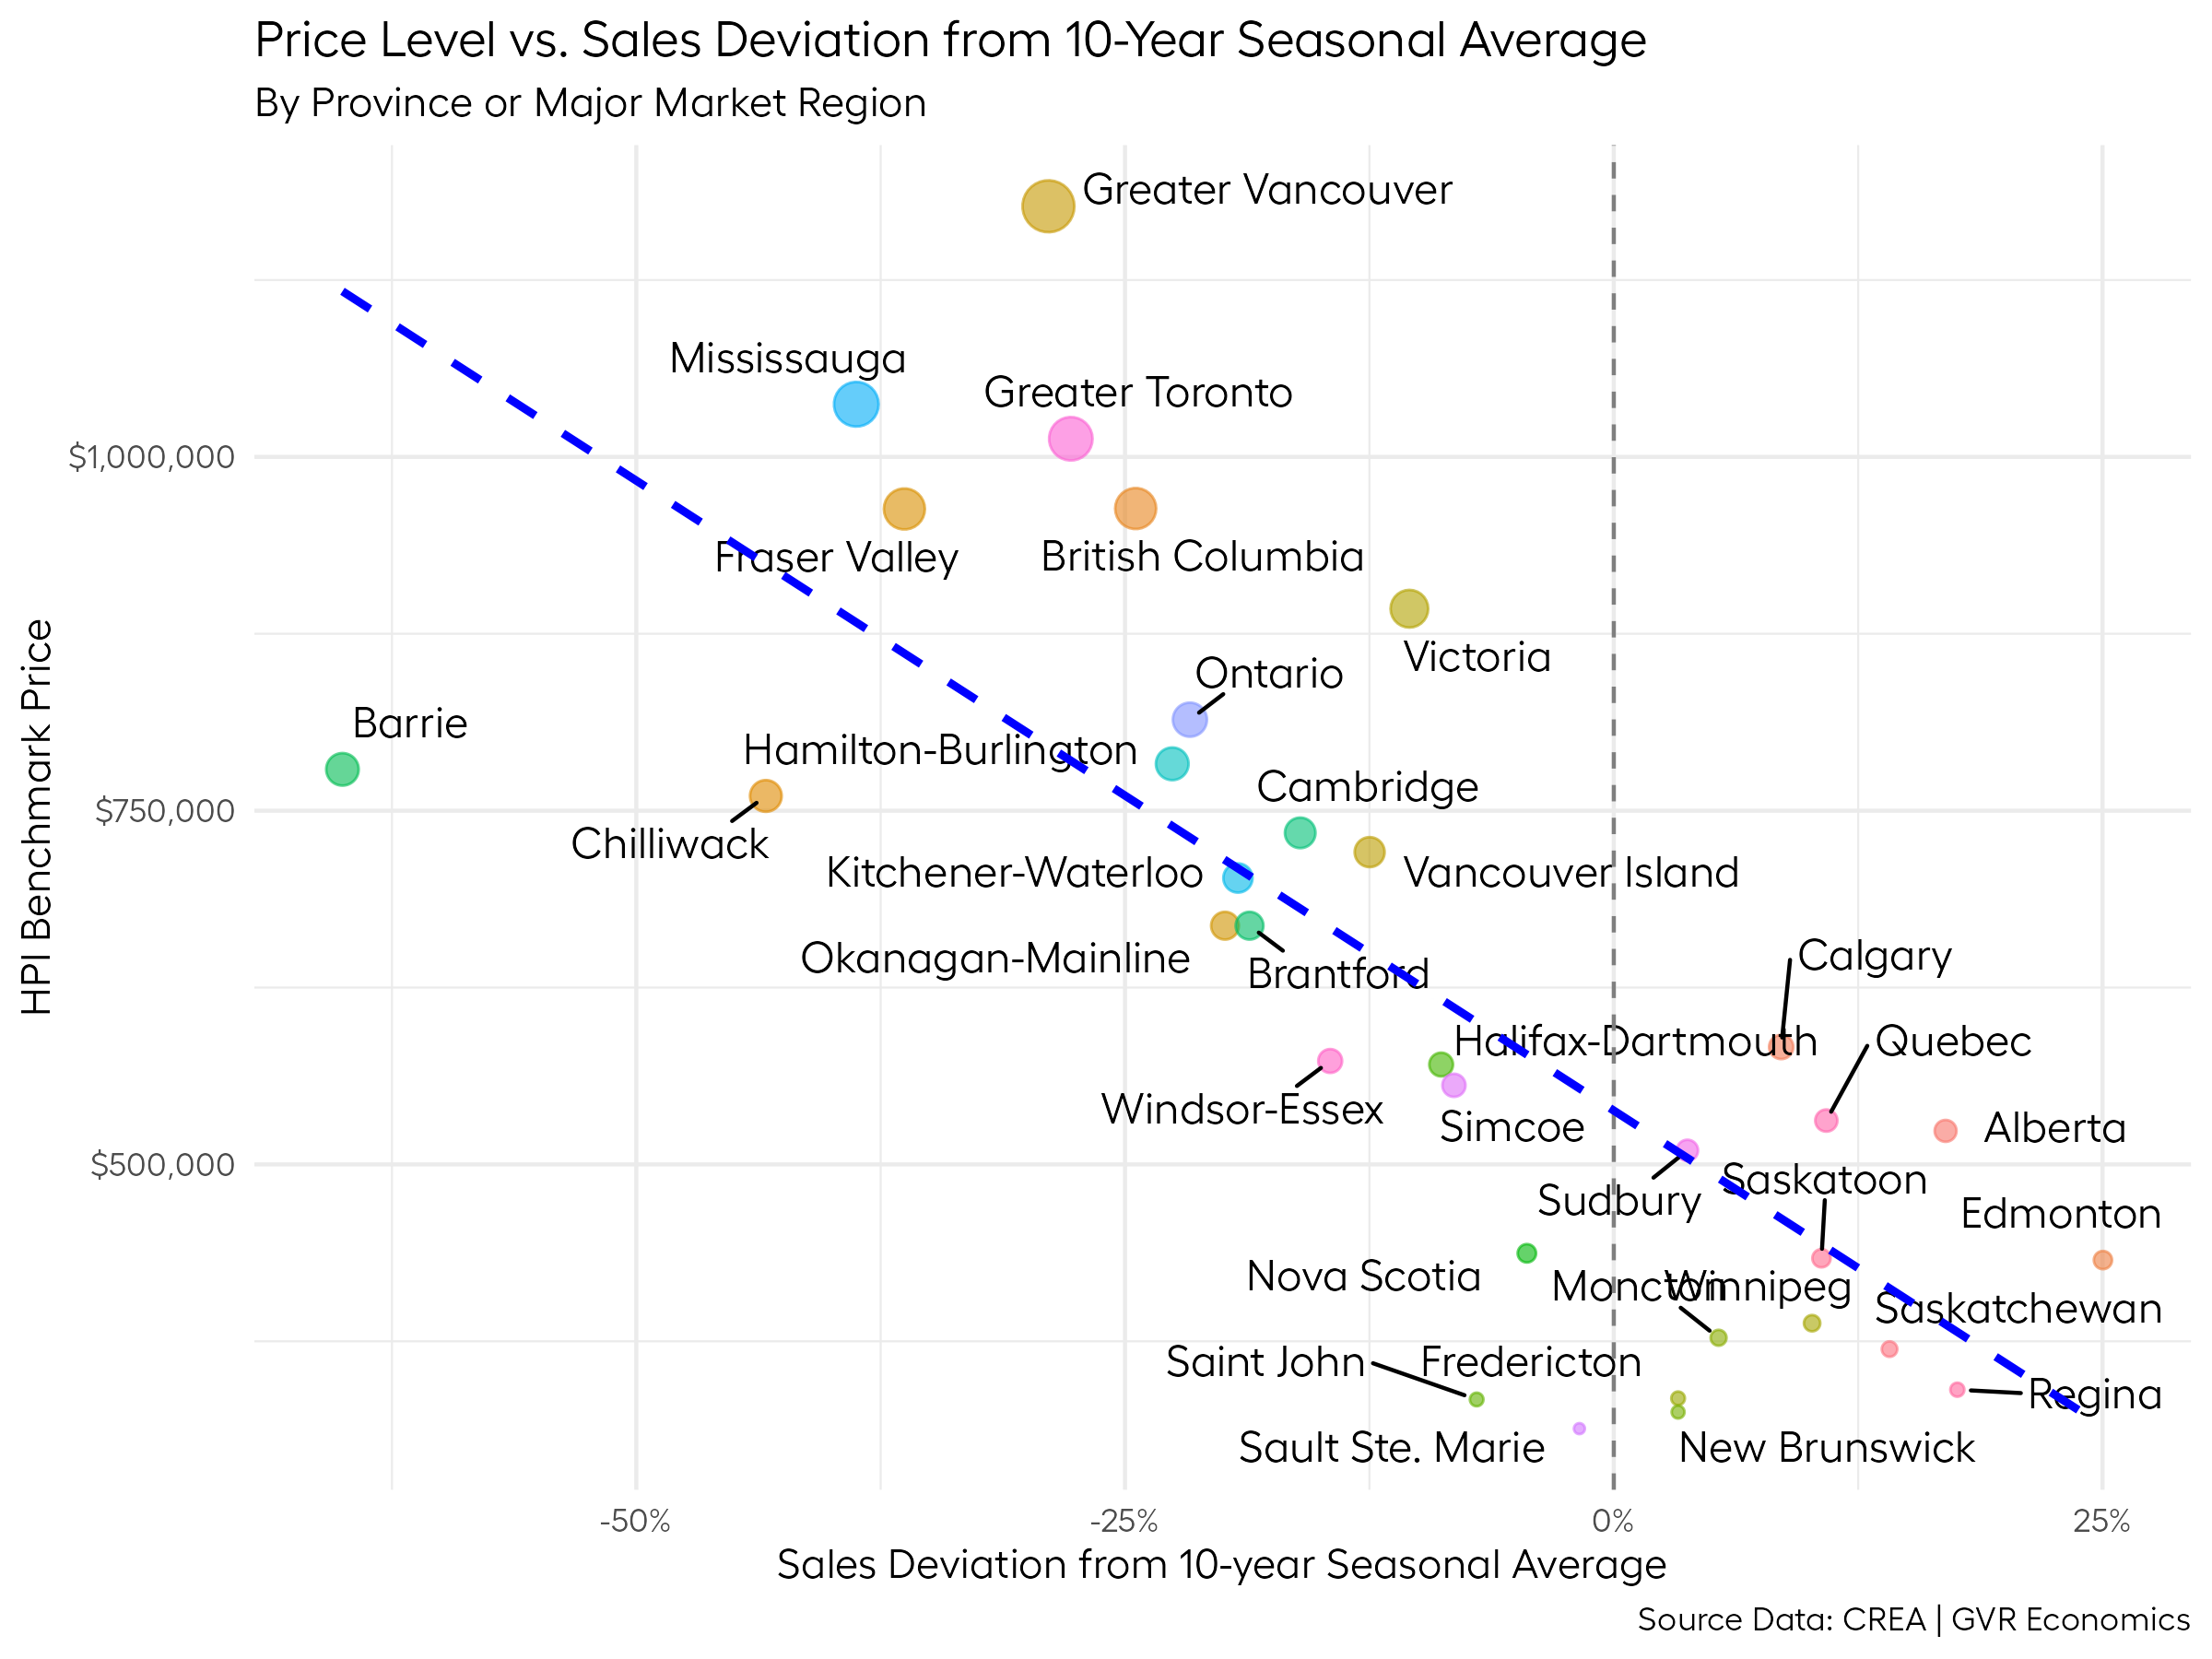
I know – it’s a bit of a complicated plot with all the lines and bubbles and whatnot.
But at a surface level, this plot says that higher-priced markets have been experiencing larger slowdowns in sales than lower-priced markets, and it’s a pretty convincingly strong relationship.
In Brendon’s post, he chalks the explanation up to uncertainty paralyzing (big, financial) decision making.
But when I was looking at this plot, I can’t say that I immediately arrived at the same conclusion7.
Poh-tay-toh; poh-tah-toh
The reasons I don’t find that conclusion super compelling are pretty simple.
Sure, it’s a fact that BC and Ontario are expensive markets and are experiencing slower sales than lower-priced markets – there’s no arguing that.
But it’s not like housing in BC and Ontario suddenly became a lot more expensive overnight.
If it were only the price level that was the explanatory factor, wouldn’t the data show that nearly every time there’s some uncertainty going on in the world, sales in BC and Ontario get hit harder than everywhere else in Canada8?
And these particular markets certainly haven’t become more expensive since Trump has been back in the White House, threatening every country on the globe with tariffs.
If anything, home prices in these expensive markets have become slightly less expensive since Trump took office.
Borrowing costs have come down too.
And despite the eye-watering price levels of homes in BC and Ontario, it’s important to remember that most people buying/selling in these markets have been doing so for a long time.
They’re quite accustomed to the high prices.
In addition, historically, all real estate markets in Canada exhibit a fairly high degree of correlation in their sales (and price) levels over time.
It’s not 1:1, but it’s a pretty tight relationship over the long haul.

So, doesn’t it seem a little bizarre that, in this specific moment, the BC and Ontario markets are straying so far from the national trend?
What could possibly be so special about these specific regions compared to elsewhere in Canada?
It’s not like the (alleged) uncertainty looming out there is something that just magically stops at the borders of BC and Ontario, right?
Surely, this uncertainty must be paralyzing (big, financial) decision-making across the country, and even across the globe?
Do we not all bleed red when sliced by the same sword?
And surely, the very real threat of major tariffs on Canadian oil exports should have had would-be-home-buying Albertans shaking in their cowboy boots, no?

Then how do we explain the fact sales in markets like Alberta and other oil-producing regions are holding up so well9?
And what about all these other markets where sales are still running close to, or above their 10-year seasonal averages?
Do home buyers/sellers in these markets not have jobs/livelihoods that could be affected by the looming uncertainty caused by all this trade war nonsense?
It just doesn’t add up.
Rather than cementing the case that uncertainty and high home prices are the primary explanatory factors behind all this, these data have raised a huge number of questions and have only further sown the seeds of reasonable doubt in my mind.
Stones left unturned
As I mentioned at the outset, this post yielded a lot more questions than answers, which is always a little unsatisfying.
And I know that people are busy, and attention spans keep getting shorter and shorter, so I’ll have to park this one for now because this post is already pretty long.
But rest assured that there’s a lot more data to look at in trying to get to the bottom of this, and I’ll be diving deeper down this rabbit hole in an upcoming post.
So, if you’ve read this far down, thanks for sticking with me, and I hope to see you in the next one!
Stay tuned.
Footnotes
That’s a rhetorical question. We knew. It’s all over the news.↩︎
Some of which are more or less plausible, and for the sake of brevity are too many to list here.↩︎
To the uninitiated, Months of Inventory (MOI) is defined as the number of months it would take to sell all the homes currently on the market, assuming the current rate of sales. This can be tracked and plotted over time as well.↩︎
I know, I know - the composite index can obscure the fact things are better/worse depending on different types of homes, but even if you break out the data that way, the story is roughly the same. Toronto is seeing more downward pressure on prices than Vancouver.↩︎
Thanks, Brendon! As if I needed another reason to think any more about this…↩︎
Since we’re just making a linear transformation of the sales data, the basic relationship will remain roughly the same, but transforming the data this way is useful for other plots presented later on.↩︎
Though I fully acknowledge this explanation remains a reasonable possibility.↩︎
As I showed in a previous post, there’s a nearly non-existent correlation between uncertainty and sales levels over time in Vancouver, so this is quite an unlikely explanation.↩︎
While these markets are certainly cheaper than many in BC and Ontario, I think if you ask most Albertans (or Canadians for that matter) whether they consider housing in Alberta “cheap”, the answer wouldn’t be a resounding “yes”. In addition, if it weren’t the case these markets have sales performing so well, the entire relationship between the price level and the sales slowdown would essentially evaporate. In a sense, the question we should be asking isn’t “why are BC and Ontario doing so poorly?” but rather “why is almost every other market in Canada doing so well?”↩︎