This one is a short post, dedicated to anyone out there feeling like they need a reason to feel optimistic about the market.
Back in December of 2024, I wrote a post analyzing what’s happened to home sales relative to the point in time when the Bank of Canada started cutting interest rates in the most recent cutting cycle.
At the time, things were starting to look up, and it appeared that housing sales were responding positively to reductions in borrowing costs just as most economists would predict (including this economist).
We’ve now had seven rate cuts since the start of the cutting cycle, including two “jumbo” 50bps cuts, bringing the policy rate down from five per cent at the start of June 2024, to the 2.75 per cent it stands currently.
Mortgage rates have also adjusted downward accordingly, with borrowing costs down significantly from last summer.
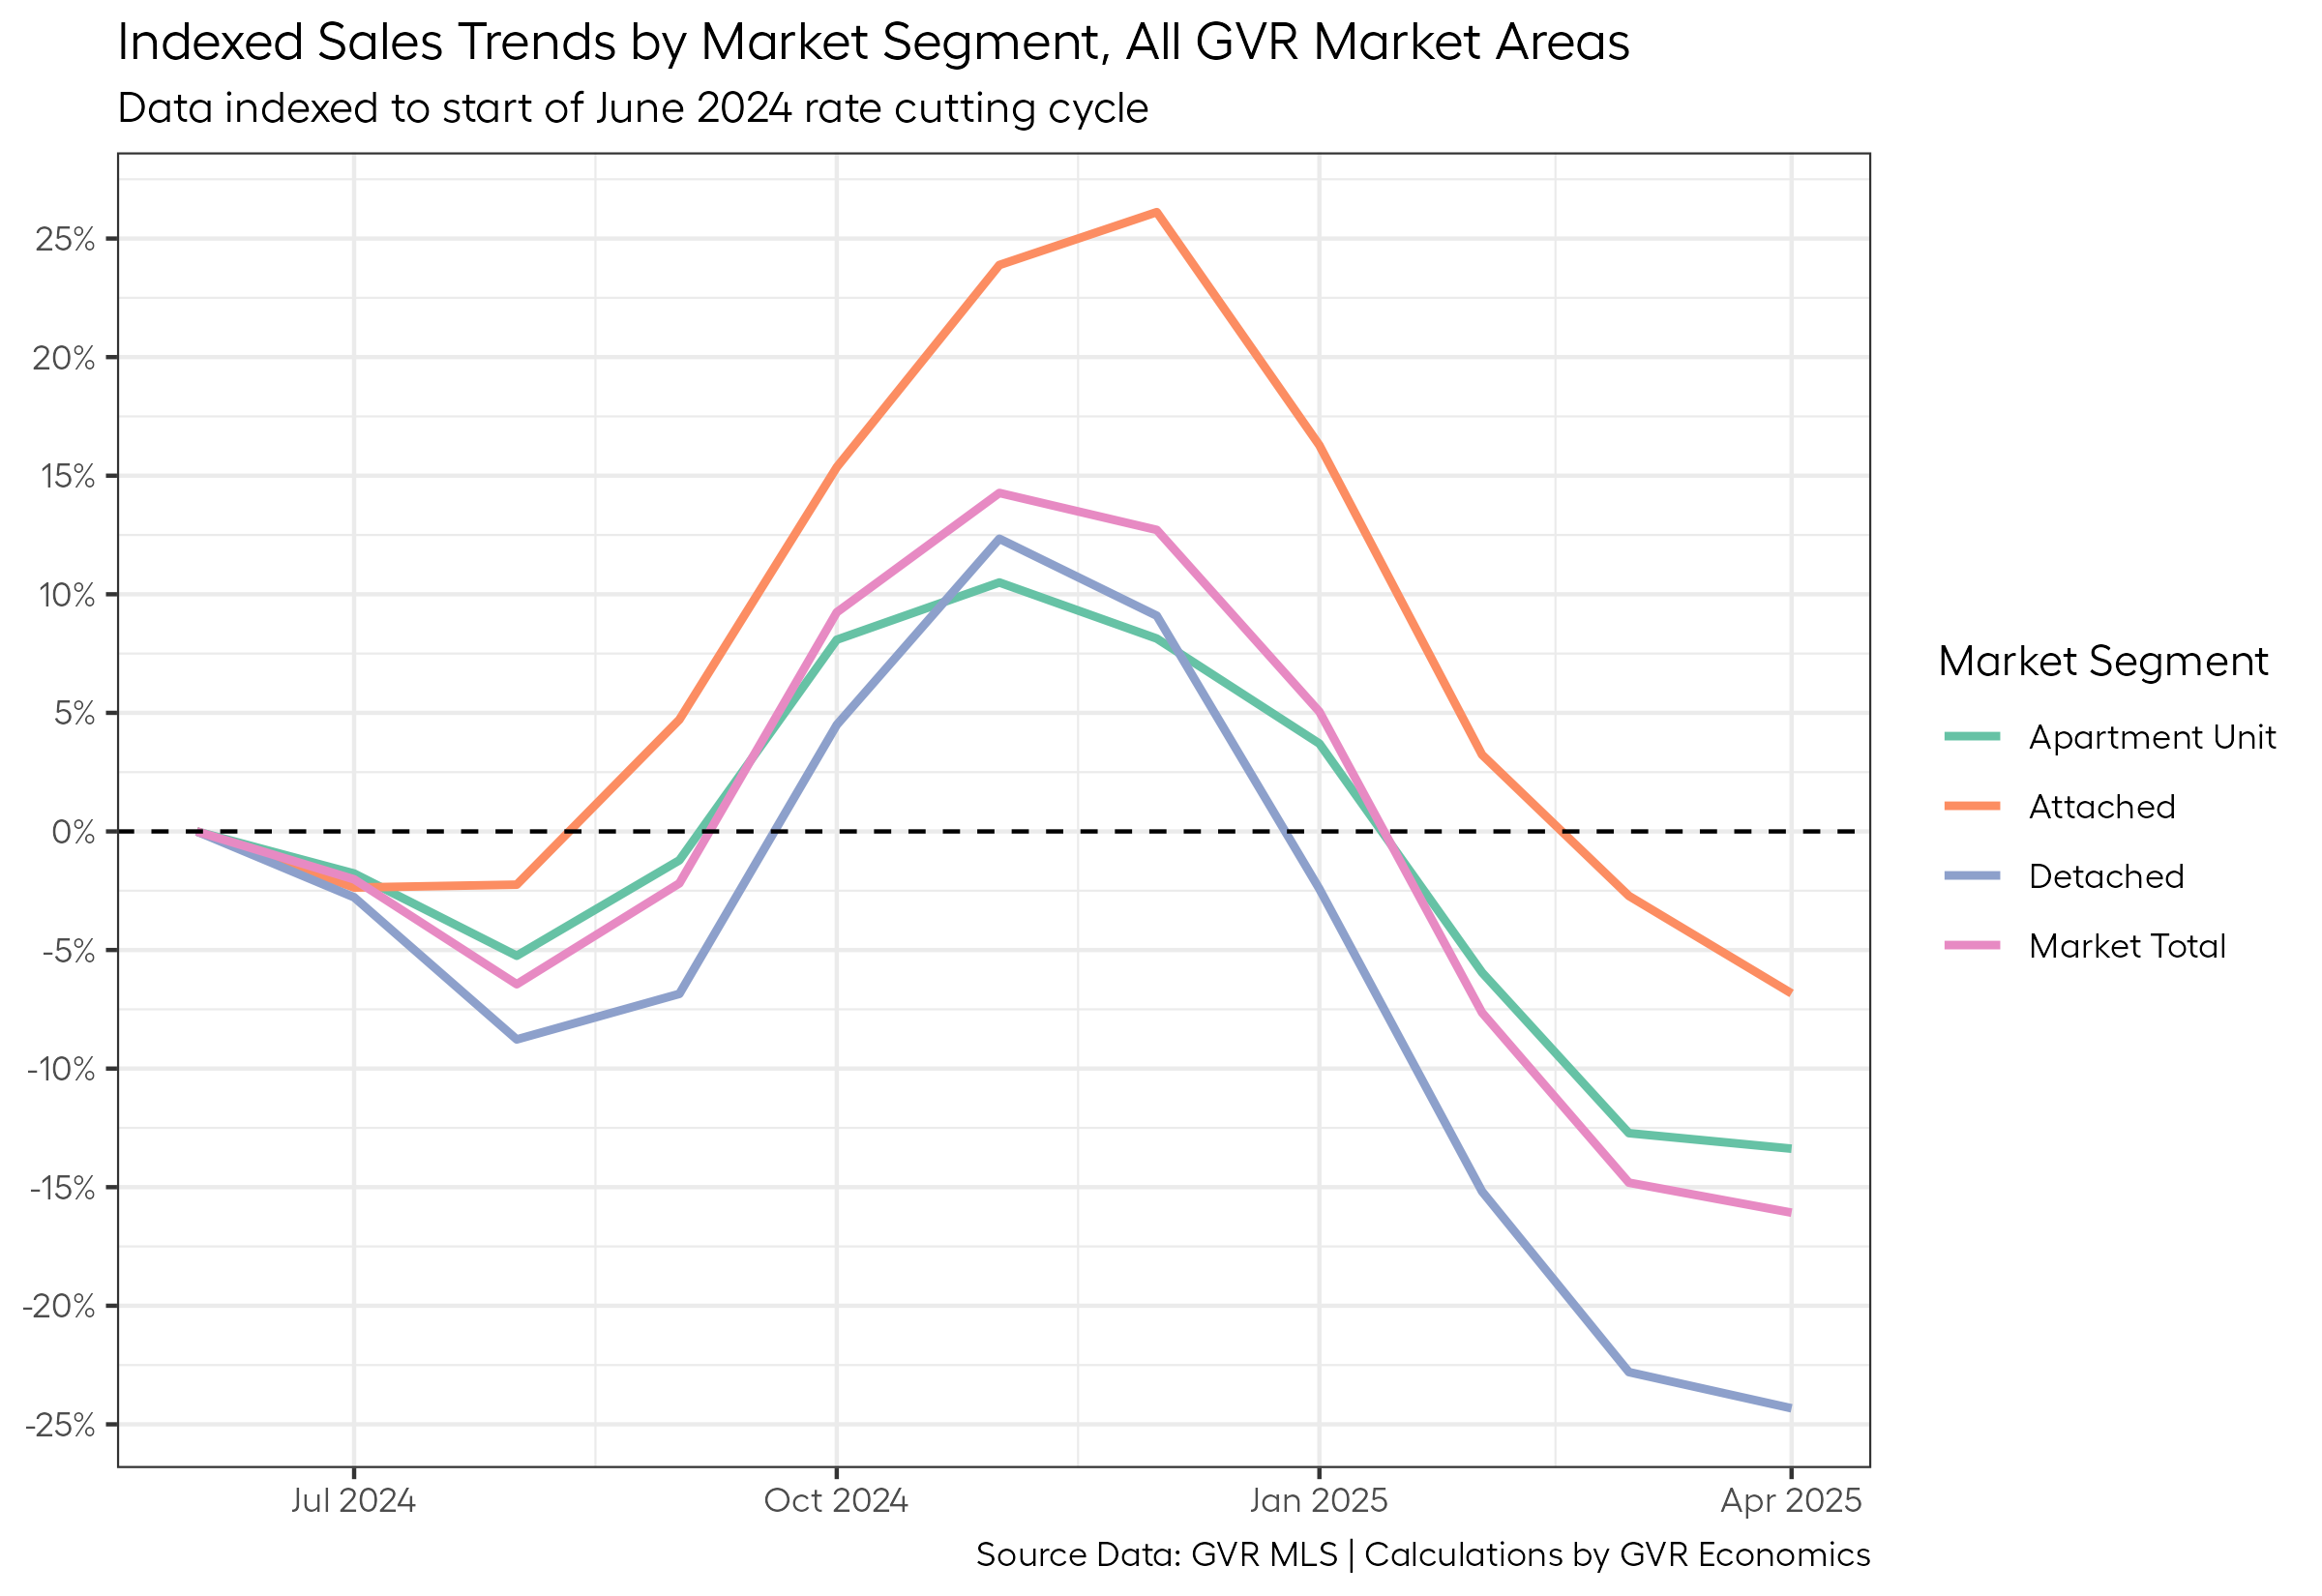
And while the odds of a further rate cut this upcoming June are maybe a little less than 50/50 at the moment, I thought it’d be interesting to revisit the chart I produced in that earlier post with some updated data to see what has transpired since.
Especially since the whole “thing with the United States” that came up recently.
Without further ado, here’s a plot of that:
Readers of this blog will know I’m not overly sympathetic to the argument that it’s entirely the fault of the uncertainty surrounding tariffs that dragged housing sales down – I think there are also some other major factors at play.
But when I revisited this plot I put together last December, I noticed something that gave me a reason to feel cautiously optimistic, and I thought that might be worth sharing.
While the reality is that sales are still feeling pretty sluggish, trending well below long-term averages, the plot above shows that the trend might be starting to turn a corner.
Just like the trend line flattened out and then started rising around August/September of 2024, we’re now starting to see the trend line flatten out again, and usually, this kind rounding out at the bottom tends to precede an upswing.
Now, I should say that just eyeballing a chart like this and calling a bottom is a lot more art than science.
And as I’m fond of saying: “anything can happen”.
But with the federal election now behind us, and (maybe?) a little more sanity prevailing around that whole “thing with the United States”, maybe we’re finally rounding the corner?
It might take a few more months to turn this train around, but as I see it, I think there’s reason to feel (cautiously) optimistic.