In a welcome pivot toward greater transparency, the Bank of Canada (BoC) recently released a summary of their (formerly internal) deliberations surrounding the January 25 decision to raise the policy rate a further 0.25 per cent, to 4.5 per cent.
While it’s not exactly a riveting read, their deliberations revealed valuable insights about the economic data they’re most closely watching, and the likelihood they’d continue increasing the policy rate over the near-term.
In short, the governing council at the bank decided that the increases to the policy over the last year appear to be having their intended impact and that going forward, they’d be adjusting “communications to indicate a conditional pause on any further policy tightening”.
The key words there are: “conditional pause”. And the condition in question is the favorability of the incoming economic data as it relates to their policy stance.
But what kind of incoming data might cause the bank to start increasing the policy rate again?
To tackle this question, we need to understand how the BoC operates and the factors they consider when they make decisions.
A matter of priorities
The first factor to consider is that the BoC operates under a monetary policy framework in which a core function is maintaining low and stable inflation.
This means the BoC may use any number of tools at their disposal to achieve this objective. Key among them is the ability to influence interest rates throughout the economy by setting the policy rate.
In broad strokes, the BoC can fine-tune credit conditions to stimulate or curb demand in the economy by adjusting this key interest rate up and down. This in turn impacts business and investment decisions, as well as consumption decisions at the household level.
In reality, the mechanics of these adjustment processes are all quite a bit more complicated than the previous sentences might imply, but for the sake of this article, it’s probably a sufficient explainer.
Listen to the data
The next factor to consider is that the BoC takes a “data-dependent” view when it decides by how much (and when) to adjust the policy rate.
Being “data dependent” means the BoC pays careful attention to a great deal of economic indicators, and they employ teams of very smart 1 people to constantly monitor these indicators and provide input to the bank on what the best course of action may be based on the latest available data.
And while there’s a schedule of eight fixed dates throughout the year when decisions are made with regard to the policy rate, one option that is always on the table is for the BoC is to do nothing at any given decision date – they don’t always have to move the rate up or down.
Are they done yet?
And it’s here where we run into a slight conundrum in definitively answering the question of how long the BoC is likely to pause any further rate hikes. The simple truth of the matter is that the BoC themselves don’t actually know how long they might hold the pause! It all depends on the incoming data.
So, what kind of data might cause the bank to take their finger off the pause button and continue increasing the policy rate?
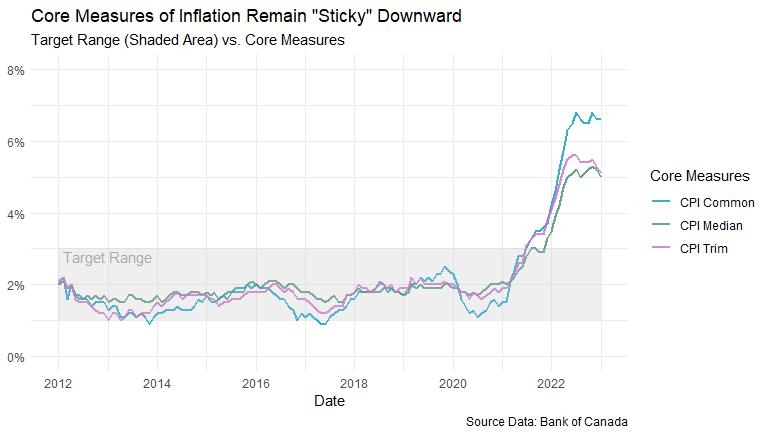
To answer that question, we need to consider what’s happening with some of the most important economic data the bank keeps an eye on. And while there’s a lot of economic data the bank watches, among the most important data are the core measures of inflation, shown in the plot below.

A few hypotheticals
The BoC aims to keep the inflation in what they call the “target range” of between one and three per cent (shown in the shaded band of the plot above).
It’s clear from the latest data that recent inflationary pressures brought inflation well outside the target, and, despite all the recent increases to the policy rate, inflation remains persistent – or what economists sometimes call “sticky”.
If the incoming data continues to suggest core inflation remains persistent and that there remains excess demand2 in the economy, the bank might have more work to do to get inflation back to the target range (i.e., more rate hikes).
By contrast, if the incoming data suggests core inflation is (finally) beginning to come back down toward the target range, the case for keeping the policy rate unchanged would be quite strong.
Under this scenario, it might even be possible to see the policy rate edge slightly lower. However, given how high inflation is right now, it’s pretty unlikely the bank will decrease the policy rate by much, if at all – at least over the next few months.
A grim possibility
Another possible scenario that might yield a lower policy rate, but would come at a significant cost, is one in which inflation remains sticky and the economy heads into a recession.
Usually, when an economy heads into a recession, central banks tend to lower interest rates to stimulate demand in an effort to cushion the negative shock to the economy.
But under this scenario, it may be very difficult for the bank to lower the policy rate for fear of stoking inflation! It’s a tricky problem we identified as a foreseeable risk in our 2023 H1 Residential Market Forecast, and it’s a problem central banks are unfortunately ill-equipped to handle.
So, while a grim scenario like this one could theoretically yield a lower policy rate, there would be other factors (i.e., recession) which would largely offset the benefits of lower borrowing costs in our market.
Thankfully, this hypothetical scenario is not the one we find ourselves right now, but only time will tell how things play out.
Upcoming posts
You can read more about rate hikes in Part II, where I’ll take a look at the historical impacts rate hikes have had on our local housing market.